Kenya Refined Petroleum Products Market (2026-2032) Outlook | Value, Trends, Revenue, Share, Industry, Analysis, Companies, Forecast, Size & Growth
Market Forecast By Product Type (Diesel, Gasoline, Fuel Oils, Kerosene, Others), By Application (Fuel, Chemical, Others), By Fraction (Light Distillates, Middle Distillates, Heavy Oils) And Competitive Landscape
| Product Code: ETC343970 | Publication Date: Aug 2022 | Updated Date: Jul 2026 | Product Type: Market Research Report | |
| Publisher: 6Wresearch | Author: Shubham Padhi | No. of Pages: 75 | No. of Figures: 35 | No. of Tables: 20 |
Kenya Refined Petroleum Products Market Size, Share & Growth Rate
The Kenya Refined Petroleum Products Market was estimated at USD 373 Million in 2025 and is projected to reach USD 500 Million by 2032, growing at a CAGR of 4.3% from 2026 to 2032. This robust growth is fueled by an expanding urban population, rising consumer demand for fuel, and a burgeoning middle class. Additionally, ongoing infrastructure development and government initiatives aimed at increasing energy efficiency are set to further propel the market's trajectory.
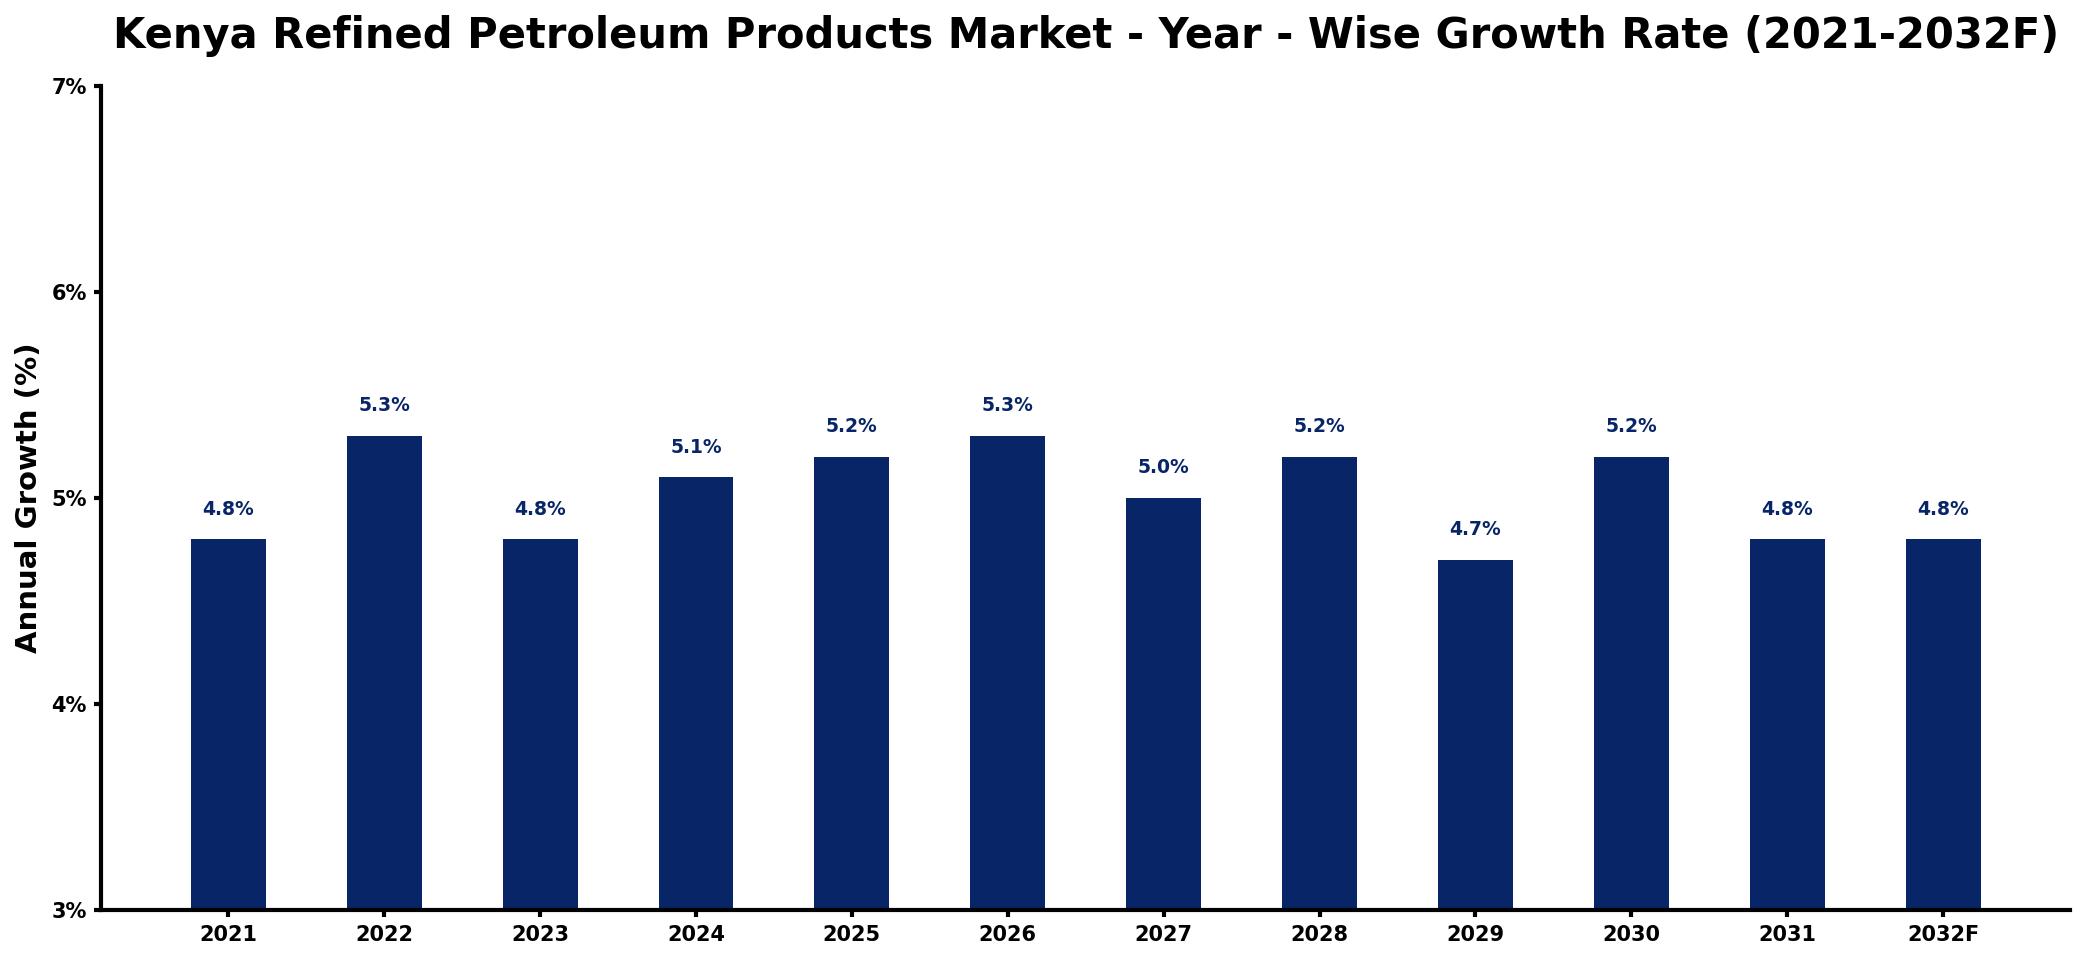
Kenya Refined Petroleum Products Market Growth Rate Analysis (2021-2032)
The Kenya refined petroleum products market has demonstrated a stable growth pattern, with a yearly increase ranging from 4.7% to 5.3% over the last few years. Notably, 2022 saw a peak growth of 5.3%, primarily driven by heightened consumer demand and significant investments in infrastructure and distribution networks. This momentum has continued into 2024 and 2025, where growth is projected at 5.1% and 5.2%. Fluctuations, such as the dip to 4.7% in 2029, can be attributed to external economic pressures and shifts towards greener energy solutions. However, the overall trend remains robust, propelled by advancements in technology and governmental policies supporting energy transition, ensuring a resilient demand for refined petroleum products in the region.
Kenya Refined Petroleum Products Market Year-wise Growth Rate and Key Drivers
This graph highlights how the Kenya Refined Petroleum Products Market has steadily grown over the past five years, supported by major growth factors.
The table below presents the year‑wise growth rates along with the key drivers influencing the market
| Year | Growth Rate | Major Drivers |
| 2021 | 4.8% | Increased transportation sector demand |
| 2022 | 5.3% | Rising industrial activity levels |
| 2023 | 4.8% | Growing urbanization and infrastructure |
| 2024 | 5.1% | Expansion in energy investments |
| 2025 | 5.2% | Higher consumer energy consumption |
| 2026 | 5.3% | Surge in agricultural equipment usage |
| 2027 | 5.0% | Boost in commercial fleet operations |
| 2028 | 5.2% | Development of new market segments |
| 2029 | 4.7% | Enhanced logistics and distribution networks |
| 2030 | 5.2% | Growing tourism and hospitality sectors |
| 2031 | 4.8% | Increased energy efficiency initiatives |
| 2032 | 4.8% | Expansion of renewable energy integration |
Note: Market size estimations and growth projections presented in this report are based on 6Wresearch's proprietary forecasting methodology, utilizing the latest available industry data, government publications, and primary research inputs.
Kenya Refined Petroleum Products Market Synopsis
The Kenya Refined Petroleum Products Market is currently witnessing a surge in demand, primarily driven by the nation's economic growth and urbanization. With the rise of the middle class and an expanding industrial sector, the consumption of gasoline and diesel is on the rise, particularly in urban areas where transportation needs are increasingly pressing.
As major oil marketing companies compete for market share, they are enhancing their distribution networks and investing in cleaner fuel alternatives. Government policies that promote sustainable energy sources further shape this competitive landscape, highlighting a transitional period for the sector.
Kenya Refined Petroleum Products Market Key Takeaways
- The market is projected to grow from USD 373 Million in 2025 to USD 500 Million by 2032, reflecting a CAGR of 4.3%.
- Urbanization and a growing middle class are significant demand drivers for refined petroleum products.
- Government policies are increasingly focused on promoting cleaner fuels and reducing carbon emissions.
- Technological advancements are reshaping consumer preferences toward fuel efficiency and alternative energy sources.
- Investment opportunities are emerging in refinery modernization, distribution, and renewable energy technologies.
Evaluation of Restraints in Kenya Refined Petroleum Products Market
Despite its growth potential, the Kenya Refined Petroleum Products Market grapples with significant restraints. Fluctuating global oil prices create uncertainty for import costs, complicating pricing strategies for industry players. Furthermore, inadequate infrastructure for storage and distribution poses logistical challenges that disrupt supply chains. The evolving regulatory landscape adds another layer of complexity, as changes in taxation or fuel quality standards necessitate continual adaptation. Lastly, intense competition among oil marketers pressures profit margins, demanding innovative strategies for differentiation and market retention.
Kenya Refined Petroleum Products Market Trends
The market is undergoing a notable shift toward cleaner and more sustainable energy sources. A growing emphasis on environmental responsibility has increased the demand for liquefied petroleum gas (LPG) and biofuels, as the government pushes for reduced carbon emissions. Simultaneously, advancements in technology are influencing fuel efficiency and accelerating the adoption of electric vehicles, thereby reshaping traditional fuel consumption patterns. As the market evolves, we see a diversification of energy sources, leading to a more environmentally conscious energy landscape.
Kenya Refined Petroleum Products Market Opportunities
Investors looking at the Kenya Refined Petroleum Products Market will find several promising avenues for growth. Modernizing existing refineries presents an opportunity to enhance production capacity and efficiency. The retail sector, particularly fuel stations and storage facilities, is poised for growth as energy demand rises. Moreover, the move toward renewable energy technologies offers significant potential, aligning with global trends toward sustainability and environmental accountability. Strategic investments that harness these trends can yield substantial returns.
Government Initiatives in the Kenya Refined Petroleum Products Market
Government policies are critical in shaping the Kenya Refined Petroleum Products Market. Regulatory frameworks govern pricing, quality standards, and importation processes, ensuring that consumers are protected while also encouraging local production. The Energy Regulatory Commission plays a vital role in setting maximum retail prices, thereby mitigating price volatility. Additionally, initiatives aimed at promoting renewable energy sources enhance energy security and lessen the nations dependence on imported fuels, ultimately fostering a more sustainable market environment.
Future Insights of the Kenya Refined Petroleum Products Market
Looking ahead to the period of 2026 to 2032, the Kenya Refined Petroleum Products Market is expected to experience steady growth. Population increases and urbanization will continue to drive fuel demand, while infrastructure improvements will support this expansion. The integration of renewable energy sources into the market dynamics will encourage a shift toward cleaner fuels. However, market participants must navigate challenges like fluctuating oil prices and regulatory changes. By remaining adaptable and innovative, companies can capitalize on the opportunities that emerge in this evolving landscape.
Kenya Refined Petroleum Products Market Latest Developments (2025 - 2026)
In the past year, the Kenya Refined Petroleum Products Market has experienced several shifts as companies adapt to changing consumer preferences and regulatory requirements. Significant investments in distribution networks have been observed, aimed at enhancing efficiency and reach. Additionally, there is a growing focus on integrating cleaner fuel options in response to government incentives for sustainability. Overall, the market is evolving with a keen eye on technological advancements and environmental impact.
Kenya Refined Petroleum Products Market - Key Attractiveness of the Report
- 10 Years of Market Numbers
- Historical Data Starting from 2022 to 2025
- Base Year: 2025
- Forecast Data until 2032
- Key Performance Indicators Impacting the Market
- Major Upcoming Developments and Projects
Key Highlights of the Report:
- Kenya Refined Petroleum Products Market Outlook
- Market Size of Kenya Refined Petroleum Products Market, 2025
- Forecast of Kenya Refined Petroleum Products Market, 2032
- Historical Data and Forecast of Kenya Refined Petroleum Products Revenues & Volume for the Period 2022-2032F
- Kenya Refined Petroleum Products Market Trend Evolution
- Kenya Refined Petroleum Products Market Drivers and Challenges
- Kenya Refined Petroleum Products Price Trends
- Kenya Refined Petroleum Products Porter's Five Forces
- Kenya Refined Petroleum Products Industry Life Cycle
- Historical Data and Forecast of Kenya Refined Petroleum Products Market Revenues & Volume By Product Type for the Period 2022-2032F
- Historical Data and Forecast of Kenya Refined Petroleum Products Market Revenues & Volume By Diesel for the Period 2022-2032F
- Historical Data and Forecast of Kenya Refined Petroleum Products Market Revenues & Volume By Gasoline for the Period 2022-2032F
- Historical Data and Forecast of Kenya Refined Petroleum Products Market Revenues & Volume By Fuel Oils for the Period 2022-2032F
- Historical Data and Forecast of Kenya Refined Petroleum Products Market Revenues & Volume By Kerosene for the Period 2022-2032F
- Historical Data and Forecast of Kenya Refined Petroleum Products Market Revenues & Volume By Others for the Period 2022-2032F
- Historical Data and Forecast of Kenya Refined Petroleum Products Market Revenues & Volume By Application for the Period 2022-2032F
- Historical Data and Forecast of Kenya Refined Petroleum Products Market Revenues & Volume By Fuel for the Period 2022-2032F
- Historical Data and Forecast of Kenya Refined Petroleum Products Market Revenues & Volume By Chemical for the Period 2022-2032F
- Historical Data and Forecast of Kenya Refined Petroleum Products Market Revenues & Volume By Others for the Period 2022-2032F
- Historical Data and Forecast of Kenya Refined Petroleum Products Market Revenues & Volume By Fraction for the Period 2022-2032F
- Historical Data and Forecast of Kenya Refined Petroleum Products Market Revenues & Volume By Light Distillates for the Period 2022-2032F
- Historical Data and Forecast of Kenya Refined Petroleum Products Market Revenues & Volume By Middle Distillates for the Period 2022-2032F
- Historical Data and Forecast of Kenya Refined Petroleum Products Market Revenues & Volume By Heavy Oils for the Period 2022-2032F
- Kenya Refined Petroleum Products Import Export Trade Statistics
- Market Opportunity Assessment By Product Type
- Market Opportunity Assessment By Application
- Market Opportunity Assessment By Fraction
- Kenya Refined Petroleum Products Top Companies Market Share
- Kenya Refined Petroleum Products Competitive Benchmarking By Technical and Operational Parameters
- Kenya Refined Petroleum Products Company Profiles
- Kenya Refined Petroleum Products Key Strategic Recommendations
Frequently Asked Questions About the Market Study (FAQs):
The growth is primarily driven by economic expansion, increased urbanization, and a rising middle class. These factors contribute to heightened demand for transportation fuels, particularly gasoline and diesel.
The Kenya Refined Petroleum Products Market is projected to grow from USD 373 Million in 2025 to USD 500 Million by 2032, achieving a CAGR of 4.3% during the period from 2026 to 2032.
Government regulations ensure fair competition, enforce quality standards, and control pricing in the market, while also promoting the use of cleaner fuels and renewable energy sources.
Companies face challenges such as fluctuating global oil prices, supply chain disruptions due to inadequate infrastructure, and increased competition among marketers which puts pressure on profit margins.
Yes, significant opportunities exist in refining modernization, expanding distribution networks, and investing in renewable energy technologies that align with the global shift toward sustainability.
There is a noticeable trend towards cleaner fuels and energy-efficient technologies. Consumers are increasingly interested in liquefied petroleum gas (LPG) and biofuels, reflecting broader environmental concerns and government initiatives to reduce carbon emissions.
6Wresearch actively monitors the Kenya Refined Petroleum Products Market and publishes its comprehensive annual report, highlighting emerging trends, growth drivers, revenue analysis, and forecast outlook. Our insights help businesses to make data-backed strategic decisions with ongoing market dynamics. Our analysts track relevent industries related to the Kenya Refined Petroleum Products Market, allowing our clients with actionable intelligence and reliable forecasts tailored to emerging regional needs.
Yes, we provide customisation as per your requirements. To learn more, feel free to contact us on sales@6wresearch.com
1 Executive Summary |
2 Introduction |
2.1 Key Highlights of the Report |
2.2 Report Description |
2.3 Market Scope & Segmentation |
2.4 Research Methodology |
2.5 Assumptions |
3 Kenya Refined Petroleum Products Market Overview |
3.1 Kenya Country Macro Economic Indicators |
3.2 Kenya Refined Petroleum Products Market Revenues & Volume, 2022 & 2032F |
3.3 Kenya Refined Petroleum Products Market - Industry Life Cycle |
3.4 Kenya Refined Petroleum Products Market - Porter's Five Forces |
3.5 Kenya Refined Petroleum Products Market Revenues & Volume Share, By Product Type, 2022 & 2032F |
3.6 Kenya Refined Petroleum Products Market Revenues & Volume Share, By Application, 2022 & 2032F |
3.7 Kenya Refined Petroleum Products Market Revenues & Volume Share, By Fraction, 2022 & 2032F |
4 Kenya Refined Petroleum Products Market Dynamics |
4.1 Impact Analysis |
4.2 Market Drivers |
4.2.1 Rapid urbanization and industrialization in Kenya leading to increased demand for refined petroleum products. |
4.2.2 Government investments in infrastructure projects driving the need for transportation fuels. |
4.2.3 Growing population and rising disposable income levels boosting the consumption of petroleum products. |
4.3 Market Restraints |
4.3.1 Volatility in global crude oil prices impacting the cost of importing refined petroleum products. |
4.3.2 Regulatory challenges and policy changes affecting the import, distribution, and pricing of petroleum products. |
4.3.3 Competition from alternative energy sources and renewable fuels posing a threat to the demand for refined petroleum products. |
5 Kenya Refined Petroleum Products Market Trends |
6 Kenya Refined Petroleum Products Market, By Types |
6.1 Kenya Refined Petroleum Products Market, By Product Type |
6.1.1 Overview and Analysis |
6.1.2 Kenya Refined Petroleum Products Market Revenues & Volume, By Product Type, 2022-2032F |
6.1.3 Kenya Refined Petroleum Products Market Revenues & Volume, By Diesel, 2022-2032F |
6.1.4 Kenya Refined Petroleum Products Market Revenues & Volume, By Gasoline, 2022-2032F |
6.1.5 Kenya Refined Petroleum Products Market Revenues & Volume, By Fuel Oils, 2022-2032F |
6.1.6 Kenya Refined Petroleum Products Market Revenues & Volume, By Kerosene, 2022-2032F |
6.1.7 Kenya Refined Petroleum Products Market Revenues & Volume, By Others, 2022-2032F |
6.2 Kenya Refined Petroleum Products Market, By Application |
6.2.1 Overview and Analysis |
6.2.2 Kenya Refined Petroleum Products Market Revenues & Volume, By Fuel, 2022-2032F |
6.2.3 Kenya Refined Petroleum Products Market Revenues & Volume, By Chemical, 2022-2032F |
6.2.4 Kenya Refined Petroleum Products Market Revenues & Volume, By Others, 2022-2032F |
6.3 Kenya Refined Petroleum Products Market, By Fraction |
6.3.1 Overview and Analysis |
6.3.2 Kenya Refined Petroleum Products Market Revenues & Volume, By Light Distillates, 2022-2032F |
6.3.3 Kenya Refined Petroleum Products Market Revenues & Volume, By Middle Distillates, 2022-2032F |
6.3.4 Kenya Refined Petroleum Products Market Revenues & Volume, By Heavy Oils, 2022-2032F |
7 Kenya Refined Petroleum Products Market Import-Export Trade Statistics |
7.1 Kenya Refined Petroleum Products Market Export to Major Countries |
7.2 Kenya Refined Petroleum Products Market Imports from Major Countries |
8 Kenya Refined Petroleum Products Market Key Performance Indicators |
8.1 Average refinery utilization rate in Kenya. |
8.2 Number of new petroleum retail outlets opened in the market. |
8.3 Growth in demand for premium/high-margin petroleum products (e.g., aviation fuel, lubricants). |
8.4 Investment in petroleum storage infrastructure in Kenya. |
8.5 Adoption rate of cleaner fuel technologies and environmental compliance standards in the petroleum sector. |
9 Kenya Refined Petroleum Products Market - Opportunity Assessment |
9.1 Kenya Refined Petroleum Products Market Opportunity Assessment, By Product Type, 2022 & 2032F |
9.2 Kenya Refined Petroleum Products Market Opportunity Assessment, By Application, 2022 & 2032F |
9.3 Kenya Refined Petroleum Products Market Opportunity Assessment, By Fraction, 2022 & 2032F |
10 Kenya Refined Petroleum Products Market - Competitive Landscape |
10.1 Kenya Refined Petroleum Products Market Revenue Share, By Companies, 2025 |
10.2 Kenya Refined Petroleum Products Market Competitive Benchmarking, By Operating and Technical Parameters |
11 Company Profiles |
12 Recommendations |
13 Disclaimer |
Global Go To Market Strategy - 2030
Export potential enables firms to identify high-growth global markets with greater confidence by combining advanced trade intelligence with a structured quantitative methodology. The framework analyzes emerging demand trends and country-level import patterns while integrating macroeconomic and trade datasets such as GDP and population forecasts, bilateral import–export flows, tariff structures, elasticity differentials between developed and developing economies, geographic distance, and import demand projections. Using weighted trade values from 2020–2024 as the base period to project country-to-country export potential for 2030, these inputs are operationalized through calculated drivers such as gravity model parameters, tariff impact factors, and projected GDP per-capita growth. Through an analysis of hidden potentials, demand hotspots, and market conditions that are most favorable to success, this method enables firms to focus on target countries, maximize returns, and global expansion with data, backed by accuracy.
By factoring in the projected importer demand gap that is currently unmet and could be potential opportunity, it identifies the potential for the Exporter (Country) among 190 countries, against the general trade analysis, which identifies the biggest importer or exporter.
To discover high-growth global markets and optimize your business strategy:
Click Here
Pricing
- Single User License$ 1,995
- Department License$ 2,400
- Site License$ 3,120
- Global License$ 3,795

Leadership Perspectives from Industry Events
Search
Thought Leadership and Analyst Meet


Our Clients
6WResearch In News
- India Air Conditioner Market Set for Strong Rebound in 2026 After Weather-Led Correction and GST-Driven Recovery: 6Wresearch
- ADAS in India: How Automatic Emergency Braking, Blind Spot Detection & Driver Monitoring are Transforming Road Safety
- Doha a strategic location for EV manufacturing hub: IPA Qatar
- Demand for luxury TVs surging in the GCC, says Samsung
- Empowering Growth: The Thriving Journey of Bangladesh’s Cable Industry
- Demand for luxury TVs surging in the GCC, says Samsung
Latest Reports
- Nicaragua RPG Gaming Market (2026-2032)
- New Zealand RPG Gaming Market (2026-2032)
- Netherlands RPG Gaming Market (2026-2032)
- Nauru RPG Gaming Market (2026-2032)
- Namibia RPG Gaming Market (2026-2032)
- Mozambique RPG Gaming Market (2026-2032)
- Montenegro RPG Gaming Market (2026-2032)
- Mongolia RPG Gaming Market (2026-2032)
- Monaco RPG Gaming Market (2026-2032)
- Micronesia RPG Gaming Market (2026-2032)
Industry Events and Analyst Meet

HIMTEX 2026

India Refining Summit 2026

India EV Show 2026

EV tech India Expo 2026

Auto Tech Asia 2026
Whitepaper
- Middle East & Africa Commercial Security Market Click here to view more.
- Middle East & Africa Fire Safety Systems & Equipment Market Click here to view more.
- GCC Drone Market Click here to view more.
- Middle East Lighting Fixture Market Click here to view more.
- GCC Physical & Perimeter Security Market Click here to view more.