Kenya Rice Husk Ash Market | Companies, Forecast, Industry, Growth, COVID-19 IMPACT, Share, Analysis, Revenue, Value, Trends & Size
Market Forecast By Silica Content (80-84%, 85-89%, 90-94%, Greater Than 95%), By Silica Extraction Process (Alkaline Extraction, Precipitated Silica Extraction, Mesoporous Silica Extraction, Sol-Gel Method), By Application (Building and Construction, Steel Industry, Ceramics and Refractory, Rubber, Others) And Competitive Landscape
| Product Code: ETC178749 | Publication Date: Jan 2022 | Updated Date: Sep 2025 | Product Type: Market Research Report | |
| Publisher: 6Wresearch | Author: Dhaval Chaurasia | No. of Pages: 70 | No. of Figures: 35 | No. of Tables: 5 |
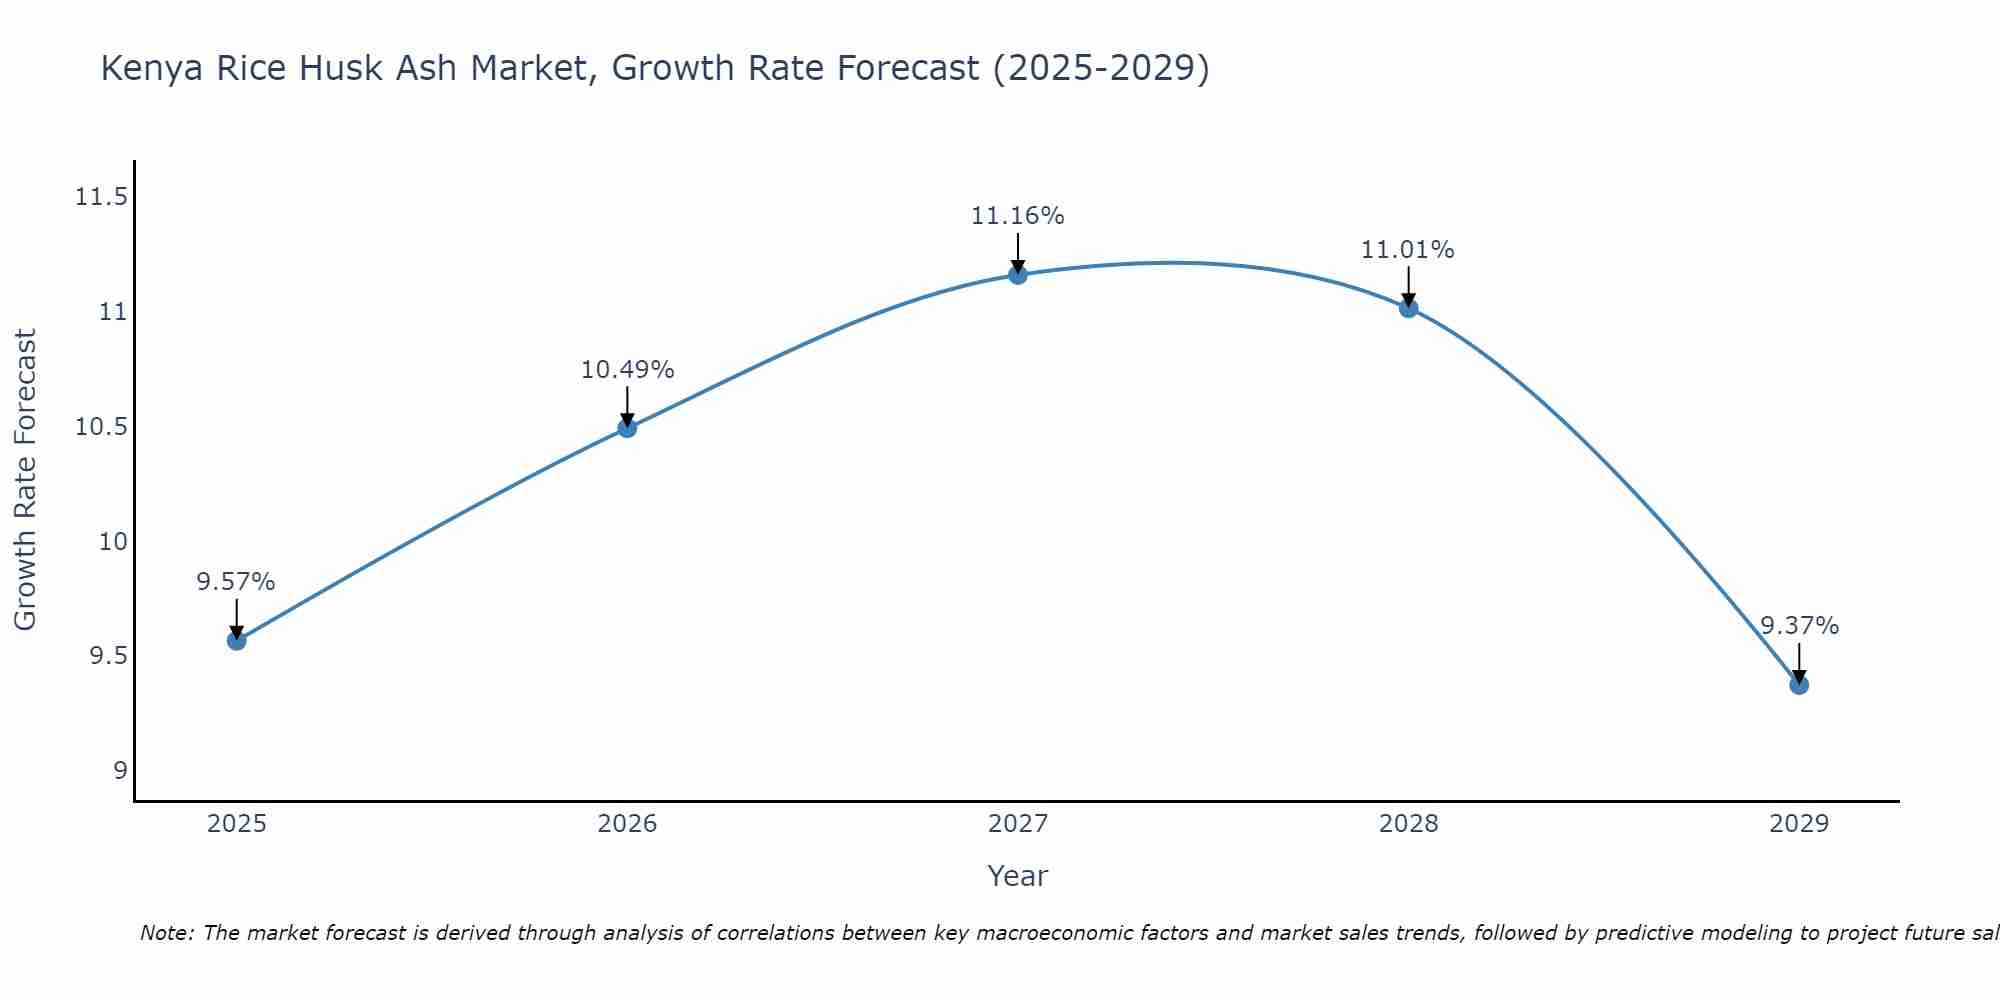
Kenya Rice Husk Ash Market Size Growth Rate
The Kenya Rice Husk Ash Market is projected to witness mixed growth rate patterns during 2025 to 2029. The growth rate begins at 9.57% in 2025, climbs to a high of 11.16% in 2027, and moderates to 9.37% by 2029.
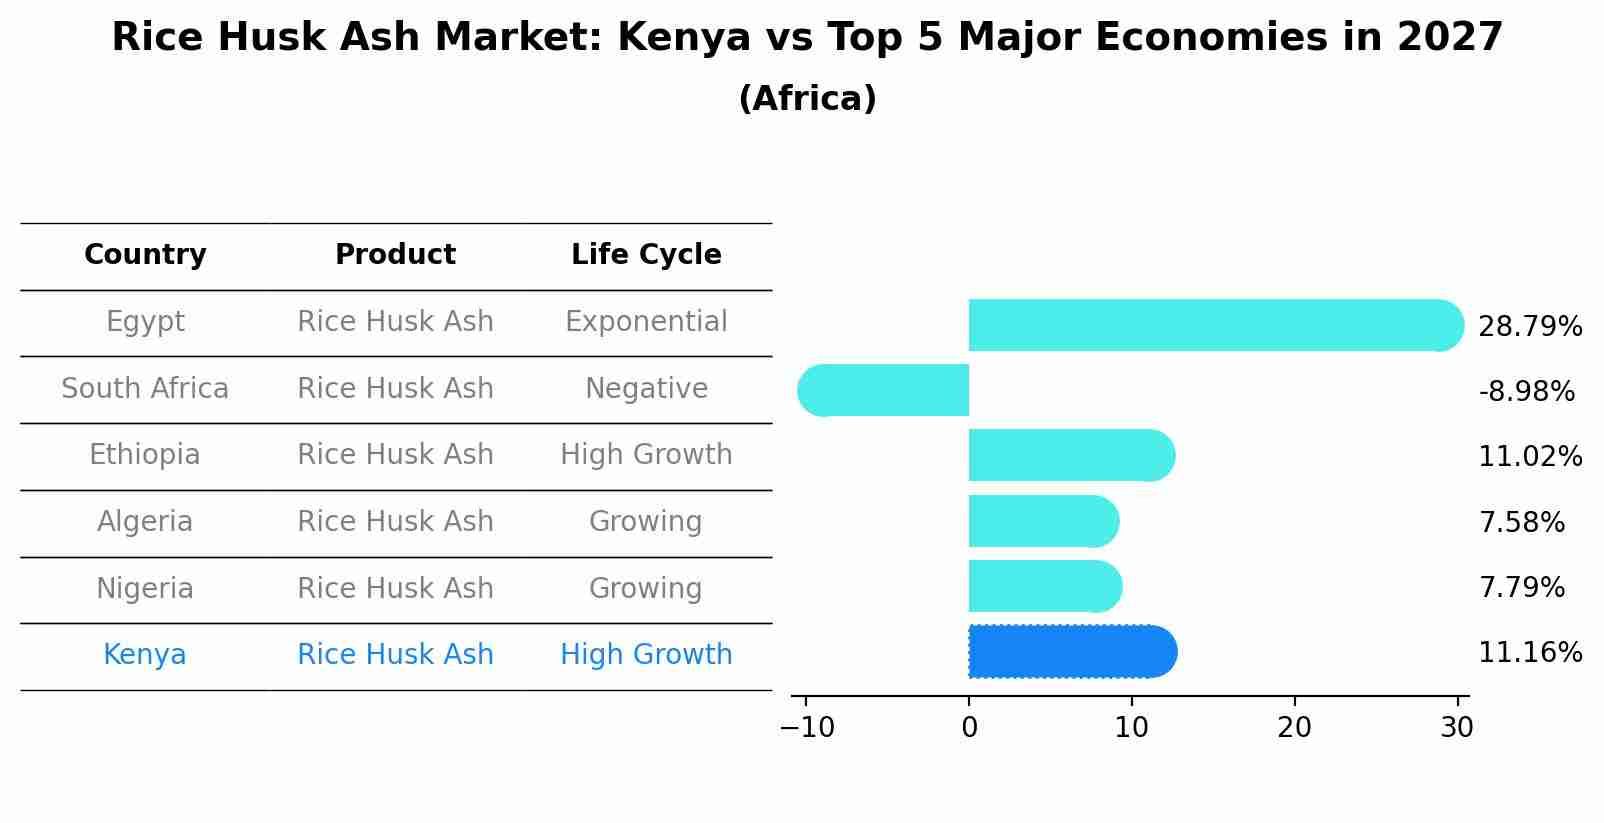
Rice Husk Ash Market: Kenya vs Top 5 Major Economies in 2027 (Africa)
The Rice Husk Ash market in Kenya is projected to grow at a high growth rate of 11.16% by 2027, highlighting the country's increasing focus on advanced technologies within the Africa region, where Egypt holds the dominant position, followed closely by South Africa, Ethiopia, Algeria and Nigeria, shaping overall regional demand.
Kenya Rice Husk Ash Market Overview
The Kenya Rice Husk Ash market is experiencing steady growth driven by its diverse applications in industries such as construction, agriculture, and manufacturing. Rice husk ash is a byproduct of rice milling and is increasingly being utilized as a sustainable alternative in various sectors due to its cost-effectiveness and eco-friendly properties. In construction, it is used as a partial replacement for cement, enhancing concrete properties and reducing environmental impact. In agriculture, it is applied as a soil amendment to improve soil fertility and crop yield. The manufacturing sector also utilizes rice husk ash in processes such as steel production and silica extraction. With the growing emphasis on sustainability and environmental conservation, the Kenya Rice Husk Ash market is poised for further expansion in the coming years.
Kenya Rice Husk Ash Market Trends
The Kenya Rice Husk Ash market is experiencing a growing demand due to its various applications in industries such as construction, agriculture, and manufacturing. The increasing awareness about the environmental benefits of using rice husk ash as a sustainable alternative to traditional materials has been a key driving factor. In construction, rice husk ash is being used in concrete production to enhance strength and durability. In agriculture, it is being utilized as a soil amendment to improve soil fertility and crop yield. Moreover, the rising interest in utilizing rice husk ash in the manufacturing of ceramics, refractories, and insulation materials is further propelling market growth. Overall, the Kenya Rice Husk Ash market is witnessing a positive trend towards sustainable practices and innovative applications.
Kenya Rice Husk Ash Market Challenges
In the Kenya Rice Husk Ash market, some challenges include inconsistent quality of the ash due to variations in rice husk sources and processing methods, which can impact its effectiveness in different applications such as construction or agriculture. Limited awareness and understanding of the benefits and potential uses of rice husk ash among potential consumers and industries also hinder market growth. Additionally, insufficient infrastructure for large-scale production and distribution of rice husk ash poses logistical challenges in meeting market demand efficiently. Regulatory barriers and lack of standardized industry guidelines further impede market development and create uncertainty for stakeholders. Overcoming these challenges will require collaboration among industry players, government support for research and development, and increased awareness campaigns to promote the benefits of utilizing rice husk ash in various sectors.
Kenya Rice Husk Ash Market Investment Opportunities
The Kenya Rice Husk Ash market offers promising investment opportunities due to the increasing demand for sustainable construction materials. Rice husk ash is being increasingly used as a supplementary cementitious material in the production of concrete, leading to improved strength, durability, and environmental sustainability. Investors can explore opportunities in setting up rice husk ash processing plants, partnering with construction companies for supply agreements, or investing in research and development for innovative applications. With the growing emphasis on green building practices and infrastructure development in Kenya, the Rice Husk Ash market presents a lucrative avenue for investment with the potential for long-term growth and impact in the construction industry.
Kenya Rice Husk Ash Market Government Policy
Government policies related to the Kenya Rice Husk Ash Market are aimed at promoting sustainable practices and supporting the growth of the agricultural sector. The government encourages the use of rice husk ash as a renewable resource in various industries, including construction, agriculture, and energy production. Additionally, there are regulations in place to ensure proper disposal and management of rice husk ash to minimize environmental impact. The government also provides incentives and subsidies to farmers and businesses involved in the production and utilization of rice husk ash, promoting innovation and economic development in the sector. Overall, government policies in Kenya support the sustainable utilization of rice husk ash, contributing to both environmental conservation and economic growth.
Kenya Rice Husk Ash Market Future Outlook
The future outlook for the Kenya Rice Husk Ash market appears promising, driven by multiple factors such as the increasing focus on sustainable and eco-friendly construction materials. Rice Husk Ash is gaining popularity as a supplementary cementitious material due to its pozzolanic properties, which improve concrete durability and strength while reducing the carbon footprint. Additionally, the growing construction industry in Kenya, coupled with government initiatives promoting green building practices, is expected to further boost the demand for Rice Husk Ash. However, challenges such as inconsistent quality standards and limited awareness among consumers may hinder market growth. Overall, with the right strategies in place to address these challenges, the Kenya Rice Husk Ash market is anticipated to witness steady growth in the coming years.
Key Highlights of the Report:
- Kenya Rice Husk Ash Market Outlook
- Market Size of Kenya Rice Husk Ash Market, 2021
- Forecast of Kenya Rice Husk Ash Market, 2031
- Historical Data and Forecast of Kenya Rice Husk Ash Revenues & Volume for the Period 2018 - 2031
- Kenya Rice Husk Ash Market Trend Evolution
- Kenya Rice Husk Ash Market Drivers and Challenges
- Kenya Rice Husk Ash Price Trends
- Kenya Rice Husk Ash Porter's Five Forces
- Kenya Rice Husk Ash Industry Life Cycle
- Historical Data and Forecast of Kenya Rice Husk Ash Market Revenues & Volume By Silica Content for the Period 2018 - 2031
- Historical Data and Forecast of Kenya Rice Husk Ash Market Revenues & Volume By 80-84% for the Period 2018 - 2031
- Historical Data and Forecast of Kenya Rice Husk Ash Market Revenues & Volume By 85-89% for the Period 2018 - 2031
- Historical Data and Forecast of Kenya Rice Husk Ash Market Revenues & Volume By 90-94% for the Period 2018 - 2031
- Historical Data and Forecast of Kenya Rice Husk Ash Market Revenues & Volume By Greater Than 95% for the Period 2018 - 2031
- Historical Data and Forecast of Kenya Rice Husk Ash Market Revenues & Volume By Silica Extraction Process for the Period 2018 - 2031
- Historical Data and Forecast of Kenya Rice Husk Ash Market Revenues & Volume By Alkaline Extraction for the Period 2018 - 2031
- Historical Data and Forecast of Kenya Rice Husk Ash Market Revenues & Volume By Precipitated Silica Extraction for the Period 2018 - 2031
- Historical Data and Forecast of Kenya Rice Husk Ash Market Revenues & Volume By Mesoporous Silica Extraction for the Period 2018 - 2031
- Historical Data and Forecast of Kenya Rice Husk Ash Market Revenues & Volume By Sol-Gel Method for the Period 2018 - 2031
- Historical Data and Forecast of Kenya Rice Husk Ash Market Revenues & Volume By Application for the Period 2018 - 2031
- Historical Data and Forecast of Kenya Rice Husk Ash Market Revenues & Volume By Building and Construction for the Period 2018 - 2031
- Historical Data and Forecast of Kenya Rice Husk Ash Market Revenues & Volume By Steel Industry for the Period 2018 - 2031
- Historical Data and Forecast of Kenya Rice Husk Ash Market Revenues & Volume By Ceramics and Refractory for the Period 2018 - 2031
- Historical Data and Forecast of Kenya Rice Husk Ash Market Revenues & Volume By Rubber for the Period 2018 - 2031
- Historical Data and Forecast of Kenya Rice Husk Ash Market Revenues & Volume By Others for the Period 2018 - 2031
- Kenya Rice Husk Ash Import Export Trade Statistics
- Market Opportunity Assessment By Silica Content
- Market Opportunity Assessment By Silica Extraction Process
- Market Opportunity Assessment By Application
- Kenya Rice Husk Ash Top Companies Market Share
- Kenya Rice Husk Ash Competitive Benchmarking By Technical and Operational Parameters
- Kenya Rice Husk Ash Company Profiles
- Kenya Rice Husk Ash Key Strategic Recommendations
Frequently Asked Questions About the Market Study (FAQs):
6Wresearch actively monitors the Kenya Rice Husk Ash Market and publishes its comprehensive annual report, highlighting emerging trends, growth drivers, revenue analysis, and forecast outlook. Our insights help businesses to make data-backed strategic decisions with ongoing market dynamics. Our analysts track relevent industries related to the Kenya Rice Husk Ash Market, allowing our clients with actionable intelligence and reliable forecasts tailored to emerging regional needs.
Yes, we provide customisation as per your requirements. To learn more, feel free to contact us on sales@6wresearch.com
1 Executive Summary |
2 Introduction |
2.1 Key Highlights of the Report |
2.2 Report Description |
2.3 Market Scope & Segmentation |
2.4 Research Methodology |
2.5 Assumptions |
3 Kenya Rice Husk Ash Market Overview |
3.1 Kenya Country Macro Economic Indicators |
3.2 Kenya Rice Husk Ash Market Revenues & Volume, 2021 & 2031F |
3.3 Kenya Rice Husk Ash Market - Industry Life Cycle |
3.4 Kenya Rice Husk Ash Market - Porter's Five Forces |
3.5 Kenya Rice Husk Ash Market Revenues & Volume Share, By Silica Content, 2021 & 2031F |
3.6 Kenya Rice Husk Ash Market Revenues & Volume Share, By Silica Extraction Process, 2021 & 2031F |
3.7 Kenya Rice Husk Ash Market Revenues & Volume Share, By Application, 2021 & 2031F |
4 Kenya Rice Husk Ash Market Dynamics |
4.1 Impact Analysis |
4.2 Market Drivers |
4.2.1 Increasing demand for sustainable and eco-friendly construction materials |
4.2.2 Rising awareness about the benefits of using rice husk ash as a pozzolan in concrete production |
4.2.3 Government initiatives promoting the use of rice husk ash in various industries |
4.3 Market Restraints |
4.3.1 Lack of awareness among potential end-users about the advantages of rice husk ash |
4.3.2 Limited availability and inconsistent quality of rice husk ash |
4.3.3 Competition from other supplementary cementitious materials in the market |
5 Kenya Rice Husk Ash Market Trends |
6 Kenya Rice Husk Ash Market, By Types |
6.1 Kenya Rice Husk Ash Market, By Silica Content |
6.1.1 Overview and Analysis |
6.1.2 Kenya Rice Husk Ash Market Revenues & Volume, By Silica Content, 2021-2031F |
6.1.3 Kenya Rice Husk Ash Market Revenues & Volume, By 80-84%, 2021-2031F |
6.1.4 Kenya Rice Husk Ash Market Revenues & Volume, By 85-89%, 2021-2031F |
6.1.5 Kenya Rice Husk Ash Market Revenues & Volume, By 90-94%, 2021-2031F |
6.1.6 Kenya Rice Husk Ash Market Revenues & Volume, By Greater Than 95%, 2021-2031F |
6.2 Kenya Rice Husk Ash Market, By Silica Extraction Process |
6.2.1 Overview and Analysis |
6.2.2 Kenya Rice Husk Ash Market Revenues & Volume, By Alkaline Extraction, 2021-2031F |
6.2.3 Kenya Rice Husk Ash Market Revenues & Volume, By Precipitated Silica Extraction, 2021-2031F |
6.2.4 Kenya Rice Husk Ash Market Revenues & Volume, By Mesoporous Silica Extraction, 2021-2031F |
6.2.5 Kenya Rice Husk Ash Market Revenues & Volume, By Sol-Gel Method, 2021-2031F |
6.3 Kenya Rice Husk Ash Market, By Application |
6.3.1 Overview and Analysis |
6.3.2 Kenya Rice Husk Ash Market Revenues & Volume, By Building and Construction, 2021-2031F |
6.3.3 Kenya Rice Husk Ash Market Revenues & Volume, By Steel Industry, 2021-2031F |
6.3.4 Kenya Rice Husk Ash Market Revenues & Volume, By Ceramics and Refractory, 2021-2031F |
6.3.5 Kenya Rice Husk Ash Market Revenues & Volume, By Rubber, 2021-2031F |
6.3.6 Kenya Rice Husk Ash Market Revenues & Volume, By Others, 2021-2031F |
7 Kenya Rice Husk Ash Market Import-Export Trade Statistics |
7.1 Kenya Rice Husk Ash Market Export to Major Countries |
7.2 Kenya Rice Husk Ash Market Imports from Major Countries |
8 Kenya Rice Husk Ash Market Key Performance Indicators |
8.1 Percentage increase in the number of construction projects using rice husk ash |
8.2 Adoption rate of rice husk ash in the construction industry |
8.3 Growth in research and development investments in rice husk ash applications |
9 Kenya Rice Husk Ash Market - Opportunity Assessment |
9.1 Kenya Rice Husk Ash Market Opportunity Assessment, By Silica Content, 2021 & 2031F |
9.2 Kenya Rice Husk Ash Market Opportunity Assessment, By Silica Extraction Process, 2021 & 2031F |
9.3 Kenya Rice Husk Ash Market Opportunity Assessment, By Application, 2021 & 2031F |
10 Kenya Rice Husk Ash Market - Competitive Landscape |
10.1 Kenya Rice Husk Ash Market Revenue Share, By Companies, 2021 |
10.2 Kenya Rice Husk Ash Market Competitive Benchmarking, By Operating and Technical Parameters |
11 Company Profiles |
12 Recommendations |
13 Disclaimer |
Export potential assessment - trade Analytics for 2030
Export potential enables firms to identify high-growth global markets with greater confidence by combining advanced trade intelligence with a structured quantitative methodology. The framework analyzes emerging demand trends and country-level import patterns while integrating macroeconomic and trade datasets such as GDP and population forecasts, bilateral import–export flows, tariff structures, elasticity differentials between developed and developing economies, geographic distance, and import demand projections. Using weighted trade values from 2020–2024 as the base period to project country-to-country export potential for 2030, these inputs are operationalized through calculated drivers such as gravity model parameters, tariff impact factors, and projected GDP per-capita growth. Through an analysis of hidden potentials, demand hotspots, and market conditions that are most favorable to success, this method enables firms to focus on target countries, maximize returns, and global expansion with data, backed by accuracy.
By factoring in the projected importer demand gap that is currently unmet and could be potential opportunity, it identifies the potential for the Exporter (Country) among 190 countries, against the general trade analysis, which identifies the biggest importer or exporter.
To discover high-growth global markets and optimize your business strategy:
Click Here
Pricing
- Single User License$ 1,995
- Department License$ 2,400
- Site License$ 3,120
- Global License$ 3,795

Search
Thought Leadership and Analyst Meet


Our Clients
Related Reports
- India Switchgear Market Outlook (2026 - 2032) | Size, Share, Trends, Growth, Revenue, Forecast, Analysis, Value, Outlook
- Pakistan Contraceptive Implants Market (2025-2031) | Demand, Growth, Size, Share, Industry, Pricing Analysis, Competitive, Strategic Insights, Strategy, Consumer Insights, Analysis, Investment Trends, Opportunities, Revenue, Segments, Value, Segmentation, Supply, Forecast, Restraints, Outlook, Competition, Drivers, Trends, Companies, Challenges
- Sri Lanka Packaging Market (2026-2032) | Outlook, Competition, Drivers, Trends, Demand, Pricing Analysis, Competitive, Strategic Insights, Companies, Challenges, Strategy, Consumer Insights, Analysis, Investment Trends, Opportunities, Growth, Size, Share, Industry, Revenue, Segments, Value, Segmentation, Supply, Forecast, Restraints
- India Kids Watches Market (2026-2032) | Strategy, Consumer Insights, Analysis, Investment Trends, Opportunities, Growth, Size, Share, Industry, Revenue, Segments, Value, Segmentation, Supply, Forecast, Restraints, Outlook, Competition, Drivers, Trends, Demand, Pricing Analysis, Competitive, Strategic Insights, Companies, Challenges
- Saudi Arabia Core Assurance Service Market (2025-2031) | Strategy, Consumer Insights, Analysis, Investment Trends, Opportunities, Growth, Size, Share, Industry, Revenue, Segments, Value, Segmentation, Supply, Forecast, Restraints, Outlook, Competition, Drivers, Trends, Demand, Pricing Analysis, Competitive, Strategic Insights, Companies, Challenges
- Romania Uninterruptible Power Supply (UPS) Market (2026-2032) | Industry, Analysis, Revenue, Size, Forecast, Outlook, Value, Trends, Share, Growth & Companies
- Saudi Arabia Car Window Tinting Film, Paint Protection Film (PPF), and Ceramic Coating Market (2025-2031) | Strategy, Consumer Insights, Analysis, Investment Trends, Opportunities, Growth, Size, Share, Industry, Revenue, Segments, Value, Segmentation, Supply, Forecast, Restraints, Outlook, Competition, Drivers, Trends, Demand, Pricing Analysis, Competitive, Strategic Insights, Companies, Challenges
- South Africa Stationery Market (2025-2031) | Share, Size, Industry, Value, Growth, Revenue, Analysis, Trends, Segmentation & Outlook
- Afghanistan Rocking Chairs And Adirondack Chairs Market (2026-2032) | Size & Revenue, Competitive Landscape, Share, Segmentation, Industry, Value, Outlook, Analysis, Trends, Growth, Forecast, Companies
- Afghanistan Apparel Market (2026-2032) | Growth, Outlook, Industry, Segmentation, Forecast, Size, Companies, Trends, Value, Share, Analysis & Revenue
Industry Events and Analyst Meet

EV tech India Expo 2026

Auto Tech Asia 2026

Battery Tech India 2026

Smart Production Solutions Guangzhou 2026

Stationery & Paper Expo Saudi Arabia 2026
Whitepaper
- Middle East & Africa Commercial Security Market Click here to view more.
- Middle East & Africa Fire Safety Systems & Equipment Market Click here to view more.
- GCC Drone Market Click here to view more.
- Middle East Lighting Fixture Market Click here to view more.
- GCC Physical & Perimeter Security Market Click here to view more.
6WResearch In News
- Doha a strategic location for EV manufacturing hub: IPA Qatar
- Demand for luxury TVs surging in the GCC, says Samsung
- Empowering Growth: The Thriving Journey of Bangladesh’s Cable Industry
- Demand for luxury TVs surging in the GCC, says Samsung
- Video call with a traditional healer? Once unthinkable, it’s now common in South Africa
- Intelligent Buildings To Smooth GCC’s Path To Net Zero