Malaysia Pest Control Products Market (2026-2032) | Forecast, Growth, Value, Revenue, Analysis, Outlook, Trends, Share, Companies, Size & Industry
Market Forecast By Type (Chemical, Mechanical, Biological, Others), By Pest type (Insects, Termites, Rodents, Others), By Application (Commercial, Residential, Agriculture, Industrial, Others) And Competitive Landscape
| Product Code: ETC027346 | Publication Date: Jun 2023 | Updated Date: Jun 2026 | Product Type: Report | |
| Publisher: 6Wresearch | Author: Ravi Bhandari | No. of Pages: 70 | No. of Figures: 35 | No. of Tables: 5 |
Malaysia Pest Control Products Market Summary
The malaysia pest control products market was estimated at USD 152 Million in 2025 and is projected to reach USD 197 Million by 2032, growing at a CAGR of 5.1% from 2026 to 2032.
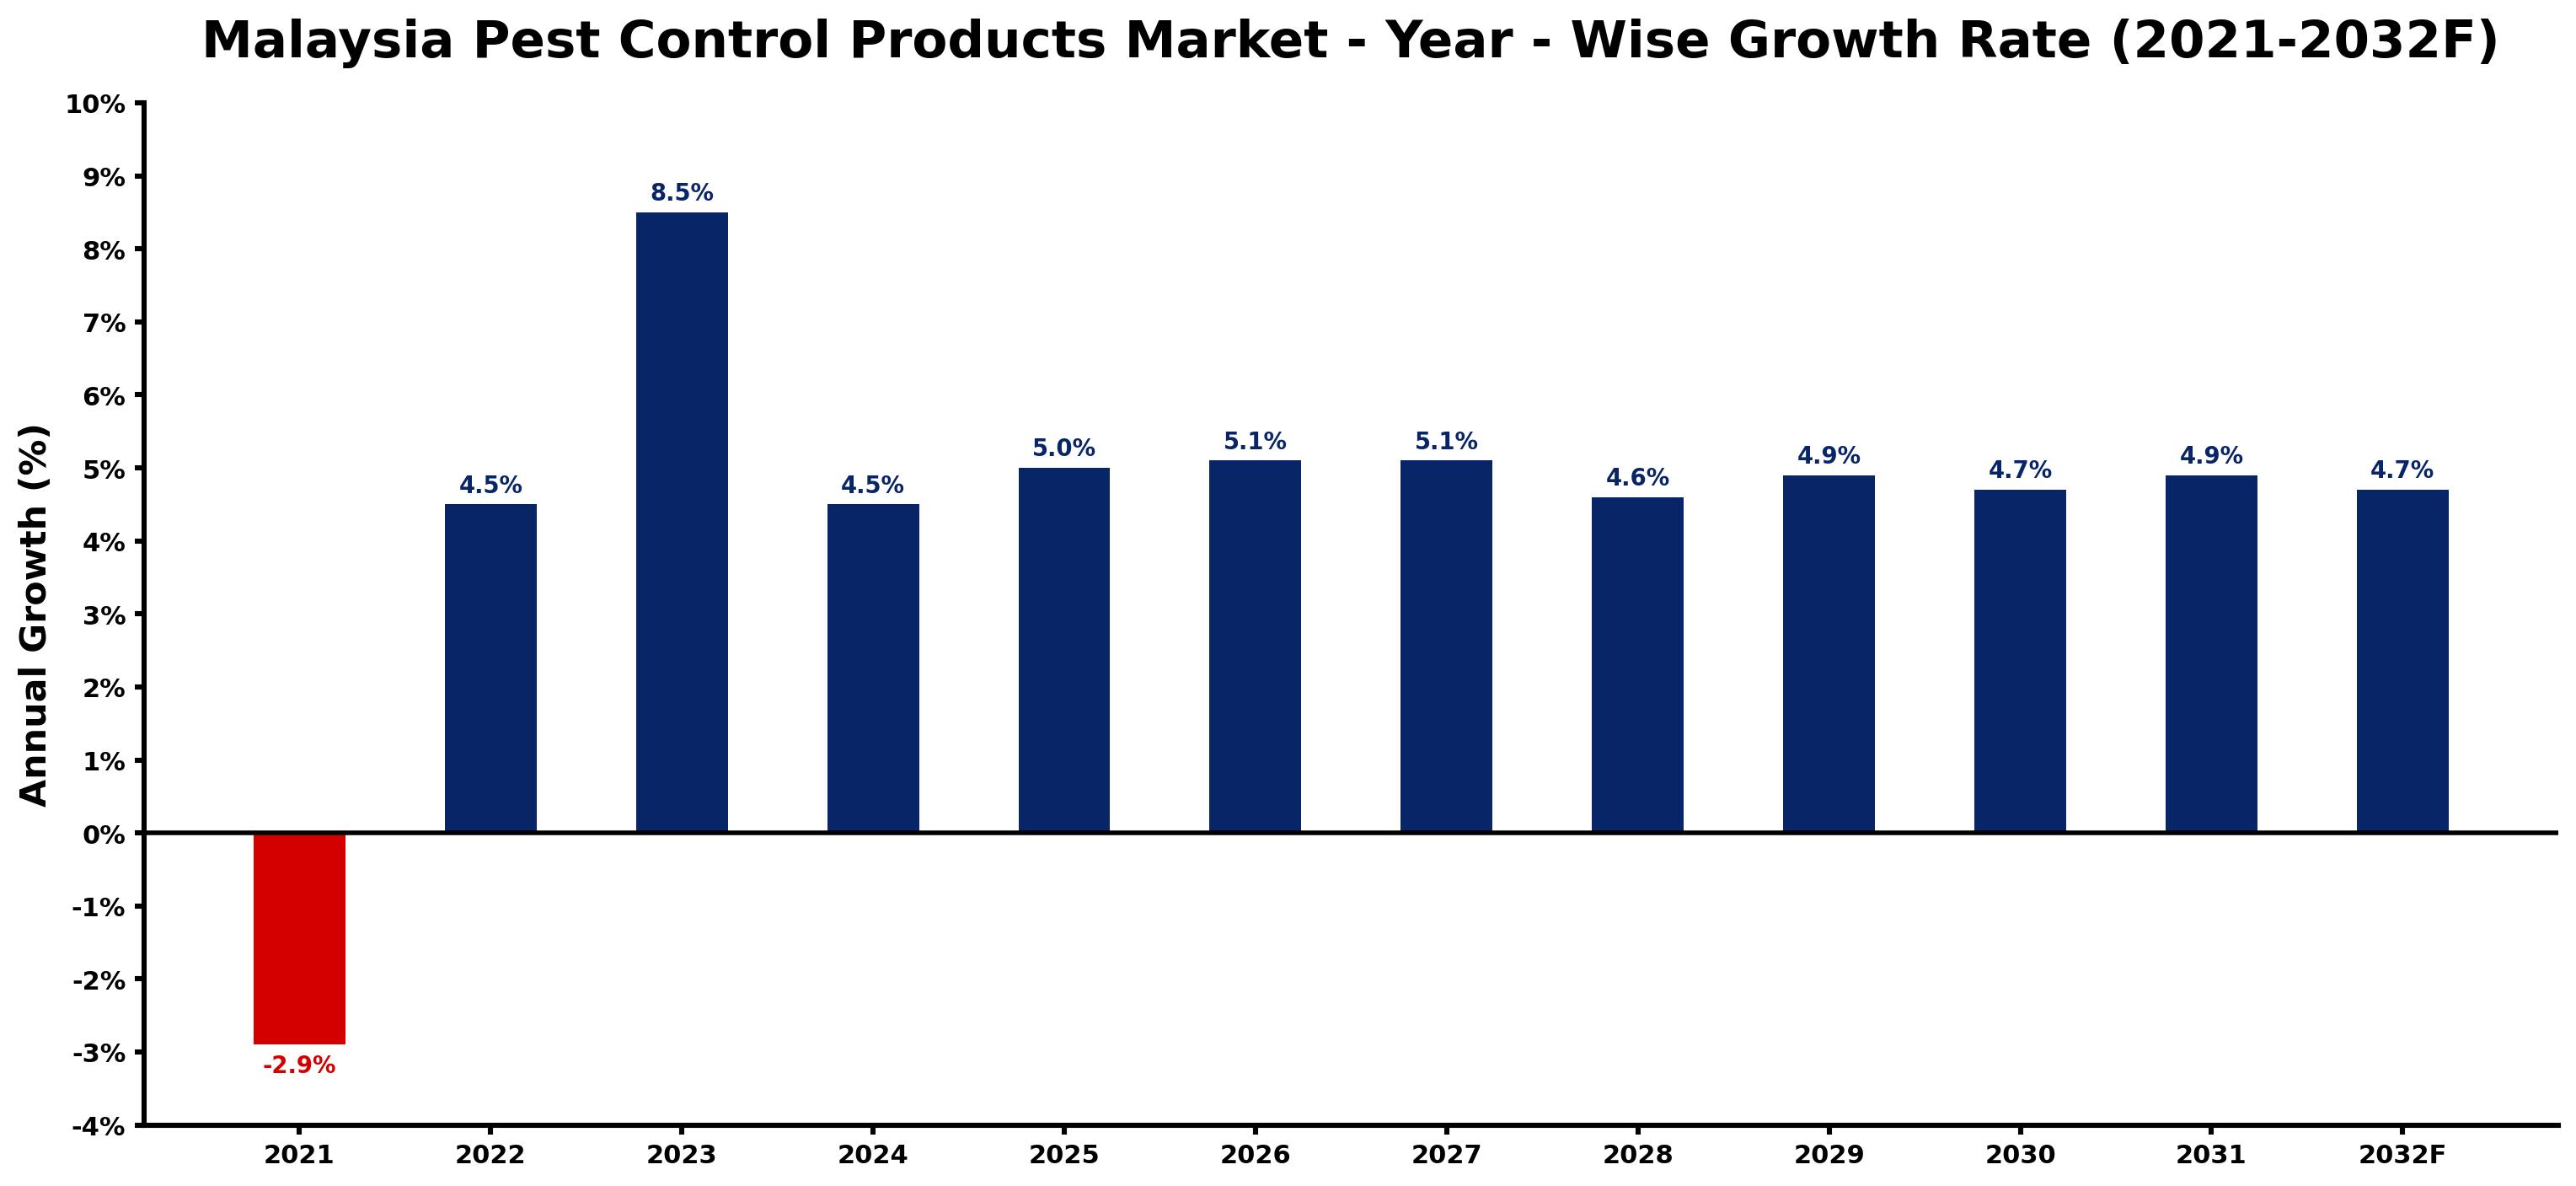
Malaysia Pest Control Products Market Growth Rate Analysis (2021-2032)
The Malaysian pest control products market has experienced notable fluctuations over the past few years. After a challenging decline of 2.9% in 2021, attributed to pandemic-related disruptions and supply chain issues, recovery began in 2022 with a growth of 4.5%. This upward trend accelerated significantly in 2023, hitting 8.5%, fueled by increased consumer awareness of health and hygiene, alongside rising investments in sustainable pest management solutions. The following years, from 2024 to 2032, show steady growth rates between 4.5% and 5.1%, driven by technological advancements in pest control methods and heightened regulatory focus on environmentally friendly products. This evolving landscape indicates a robust outlook for the sector as it adapts to changing consumer preferences and industry standards.
Malaysia Pest Control Products Market Year-wise Growth Rate and Key Drivers
This graph highlights how the Malaysia Pest Control Products Market has steadily grown over the past five years, supported by major growth factors.
The table below presents the year wise growth rates along with the key drivers influencing the market
| Year | Growth Rate | Major Drivers |
| 2021 | -2.9% | Supply chain disruptions caused by the pandemic hindered product availability, leading to decreased customer purchases. |
| 2022 | 4.5% | Urbanization trends led to increased demand for pest management in residential areas. |
| 2023 | 8.5% | Heightened awareness of public health risks fueled interest in professional pest services. |
| 2024 | 4.5% | Sustainability concerns prompted innovation in eco-friendly pest control formulations. |
| 2025 | 5.0% | Rising disposable incomes influenced consumer spending on pest control maintenance services. |
| 2026 | 5.1% | Technological advancements in pest detection devices improved service efficiency and effectiveness. |
| 2027 | 5.1% | Emerging pest resistance issues necessitated development of novel pest management strategies. |
| 2028 | 4.6% | Increased tourism rates drove demand for pest control in hospitality sectors. |
| 2029 | 4.9% | Expansion of agricultural practices highlighted need for integrated pest management solutions. |
| 2030 | 4.7% | E-commerce platforms facilitated easier access to pest control products for consumers. |
| 2031 | 4.9% | Shifting lifestyles and remote work trends reshaped pest control service expectations. |
| 2032 | 4.7% | Dynamic market regulations influenced product formulations and pest control service standards. |
Note - Market size estimations and growth projections presented in this report are based on 6Wresearch's advanced forecasting approach, validated with industry datasets as of June 2026.
Malaysia Pest Control Products Market Synopsis
The Malaysia Pest Control Products Market is projected to reach 5.1% and witness significant growth during the forecast period (2026-2032). The anticipated compound annual growth rate (CAGR) of 4.8% reflects a robust demand driven by various factors including heightened public awareness regarding pest control measures and disease prevention. Government initiatives, particularly subsidies promoting eco-friendly products, significantly influence market dynamics. As urbanization continues to accelerate, the resultant infrastructural development creates additional habitats for pests, thereby fuelling the demand for effective pest control solutions.
Malaysia Pest Control Products Market Growth Drivers
Several factors are integral to the growth of the Malaysia Pest Control Products Market. Firstly, the increasing public awareness about health and hygiene has led consumers to prioritize pest control, recognizing its role in maintaining a safe living environment. Secondly, government backing through initiatives aimed at promoting sustainable pest control practices contributes directly to the rising adoption of eco-friendly products.
- The rapid pace of urbanization in Malaysia is a primary driver, expanding the prevalence of pest populations that necessitate control measures.
- Health crises such as the Covid-19 pandemic have heightened focus on health safety, steering consumers towards organic and less harmful pest control solutions.
- Technological advancements, such as the development and implementation of Integrated Pest Management (IPM) strategies, provide more environmentally friendly alternatives to traditional chemical pesticides.
- The increasing construction of residential and commercial establishments boosts demand for pest control services, as new properties often face pest-related challenges.
- Growing concern over pest-related diseases fosters a proactive approach among consumers and businesses, increasing the need for effective pest management solutions.
Malaysia Pest Control Products Market Trends and Opportunities
The landscape of the Malaysia Pest Control Products Market is evolving, marked by notable trends that signify changing consumer preferences and technological advancements. There is a distinct trend towards organic pest control solutions, spurred by health-conscious consumers. This shift reflects a broader movement towards sustainability and environmental stewardship.
- Increased collaboration between government and private sectors fosters innovation in pest control technologies that are both effective and environmentally friendly.
- The emphasis on health and safety continues to drive demand for organic solutions, presenting opportunities for manufacturers specializing in non-toxic products.
- Awareness campaigns led by government and NGOs play a crucial role in educating the public about the importance and benefits of pest control, encouraging wider adoption.
- Digital platforms are increasingly being utilized for pest control services, allowing consumers to access solutions more conveniently while enhancing service delivery efficiencies.
- The market is witnessing growth across different end-use segments, including residential, commercial, and agricultural sectors, each presenting unique opportunities for targeted product development.
Malaysia Pest Control Products Market Challenges and Restraints
Despite the growth potential, the Malaysia Pest Control Products Market faces several challenges that may impede its progress. Regulatory hurdles related to the registration and approval of new products can delay market entry for innovative solutions. Additionally, the presence of counterfeit products poses significant risks, undermining consumer trust and safety.
- Market participants must navigate the complex landscape of regulatory compliance, which can vary significantly across different regions within Malaysia.
- Consumers' price sensitivity may affect their willingness to invest in higher-value eco-friendly products, leading to a preference for cheaper, less sustainable options.
- The growing incidence of pest resistance to certain chemical products necessitates ongoing innovation and research to develop more effective solutions.
- Competition from informal service providers who might offer lower prices without adhering to safety standards challenges regulated pest control businesses.
- Economic fluctuations can impact consumer spending on pest control services, leading to variability in demand across different market segments.
Malaysia Pest Control Products Market Government Investment and Initiatives
The Malaysian government has recognized the critical importance of pest control in contributing to public health and safety. As part of its commitment to enhance pest management practices, the government has initiated several programs aimed at promoting sustainable pest control solutions. Subsidies on eco-friendly pest control products have been introduced to encourage consumers and businesses to opt for safer alternatives.
- The government's strategic plans focus on integrating pest management into public health policies, promoting greater awareness and engagement among communities.
- Investment in research and development by the government aids in the innovation of new pest control technologies that align with environmental standards.
- Public spending is being redirected towards training programs for pest control professionals, enhancing their capabilities in implementing modern pest management techniques.
- Collaboration with academic institutions and industry players aims to foster knowledge-sharing and innovation in pest control methodologies.
- Government campaigns aimed at educating the public about pest prevention and control are essential in shifting consumer attitudes towards proactive pest management.
Malaysia Pest Control Products Market Latest Developments (May 2025 - June 2026)
During the period between May 2025 and June 2026, the Malaysia Pest Control Products Market has undergone significant developments. The emphasis on sustainable practices has led to an increase in product offerings that cater to eco-friendly solutions, reflecting a broader trend in consumer preferences towards safety and sustainability. Additionally, technological advancements have facilitated the development of integrated pest management solutions, marking a shift towards more holistic approaches to pest control.
- New partnerships between public and private sectors have been established to develop innovative pest control strategies, enhancing the efficacy of existing solutions.
- Increased awareness campaigns have been launched to educate consumers on the benefits of pest control, emphasizing the health implications of pest infestations.
- The market has seen an emergence of digital platforms for pest control services, improving accessibility and customer engagement.
- Policy shifts have been observed, with greater governmental support directed towards pest control initiatives as part of public health mandates.
- Research investments have enhanced the availability of organic pest control options, aligning with consumer preferences for non-toxic solutions.
Malaysia Pest Control Products Market - Key Attractiveness of the Report
- 10 Years of Market Numbers
- Historical Data Starting from 2022 to 2025
- Base Year: 2025
- Forecast Data until 2032
- Key Performance Indicators Impacting the Market
- Major Upcoming Developments and Projects
Key Highlights of the Report:
- Malaysia Pest Control Products Market Outlook
- Market Size of Malaysia Pest Control Products Market, 2025
- Forecast of Malaysia Pest Control Products Market, 2032
- Historical Data and Forecast of Malaysia Pest Control Products Revenues & Volume for the Period 2022-2032F
- Malaysia Pest Control Products Market Trend Evolution
- Malaysia Pest Control Products Market Drivers and Challenges
- Malaysia Pest Control Products Price Trends
- Malaysia Pest Control Products Porter's Five Forces
- Malaysia Pest Control Products Industry Life Cycle
- Historical Data and Forecast of Malaysia Pest Control Products Market Revenues & Volume By Type for the Period 2022-2032F
- Historical Data and Forecast of Malaysia Pest Control Products Market Revenues & Volume By Chemical for the Period 2022-2032F
- Historical Data and Forecast of Malaysia Pest Control Products Market Revenues & Volume By Mechanical for the Period 2022-2032F
- Historical Data and Forecast of Malaysia Pest Control Products Market Revenues & Volume By Biological for the Period 2022-2032F
- Historical Data and Forecast of Malaysia Pest Control Products Market Revenues & Volume By Others for the Period 2022-2032F
- Historical Data and Forecast of Malaysia Pest Control Products Market Revenues & Volume By Pest type for the Period 2022-2032F
- Historical Data and Forecast of Malaysia Pest Control Products Market Revenues & Volume By Insects for the Period 2022-2032F
- Historical Data and Forecast of Malaysia Pest Control Products Market Revenues & Volume By Termites for the Period 2022-2032F
- Historical Data and Forecast of Malaysia Pest Control Products Market Revenues & Volume By Rodents for the Period 2022-2032F
- Historical Data and Forecast of Malaysia Pest Control Products Market Revenues & Volume By Others for the Period 2022-2032F
- Historical Data and Forecast of Malaysia Pest Control Products Market Revenues & Volume By Application for the Period 2022-2032F
- Historical Data and Forecast of Malaysia Pest Control Products Market Revenues & Volume By Commercial for the Period 2022-2032F
- Historical Data and Forecast of Malaysia Pest Control Products Market Revenues & Volume By Residential for the Period 2022-2032F
- Historical Data and Forecast of Malaysia Pest Control Products Market Revenues & Volume By Agriculture for the Period 2022-2032F
- Historical Data and Forecast of Malaysia Pest Control Products Market Revenues & Volume By Industrial for the Period 2022-2032F
- Historical Data and Forecast of Malaysia Pest Control Products Market Revenues & Volume By Others for the Period 2022-2032F
- Malaysia Pest Control Products Import Export Trade Statistics
- Market Opportunity Assessment By Type
- Market Opportunity Assessment By Pest type
- Market Opportunity Assessment By Application
- Malaysia Pest Control Products Top Companies Market Share
- Malaysia Pest Control Products Competitive Benchmarking By Technical and Operational Parameters
- Malaysia Pest Control Products Company Profiles
- Malaysia Pest Control Products Key Strategic Recommendations
Frequently Asked Questions About the Market Study (FAQs):
Key drivers include increased public awareness about health safety, government support for eco-friendly solutions, and urbanization leading to greater pest populations.
The government is implementing subsidies for eco-friendly products, enhancing public education on pest management, and investing in research and development.
Challenges include regulatory compliance, the prevalence of counterfeit products, and competition from informal service providers.
The market is witnessing trends towards organic pest control solutions, technological innovations, and increased collaboration between public and private sectors to enhance pest management strategies.
6Wresearch actively monitors the Malaysia Pest Control Products Market and publishes its comprehensive annual report, highlighting emerging trends, growth drivers, revenue analysis, and forecast outlook. Our insights help businesses to make data-backed strategic decisions with ongoing market dynamics. Our analysts track relevent industries related to the Malaysia Pest Control Products Market, allowing our clients with actionable intelligence and reliable forecasts tailored to emerging regional needs.
Yes, we provide customisation as per your requirements. To learn more, feel free to contact us on sales@6wresearch.com
1 Executive Summary |
2 Introduction |
2.1 Key Highlights of the Report |
2.2 Report Description |
2.3 Market Scope & Segmentation |
2.4 Research Methodology |
2.5 Assumptions |
3 Malaysia Pest Control Products Market Overview |
3.1 Malaysia Country Macro Economic Indicators |
3.2 Malaysia Pest Control Products Market Revenues & Volume, 2022 & 2032F |
3.3 Malaysia Pest Control Products Market - Industry Life Cycle |
3.4 Malaysia Pest Control Products Market - Porter's Five Forces |
3.5 Malaysia Pest Control Products Market Revenues & Volume Share, By Type, 2022 & 2032F |
3.6 Malaysia Pest Control Products Market Revenues & Volume Share, By Pest type, 2022 & 2032F |
3.7 Malaysia Pest Control Products Market Revenues & Volume Share, By Application, 2022 & 2032F |
4 Malaysia Pest Control Products Market Dynamics |
4.1 Impact Analysis |
4.2 Market Drivers |
4.3 Market Restraints |
5 Malaysia Pest Control Products Market Trends |
6 Malaysia Pest Control Products Market, By Types |
6.1 Malaysia Pest Control Products Market, By Type |
6.1.1 Overview and Analysis |
6.1.2 Malaysia Pest Control Products Market Revenues & Volume, By Type, 2022-2032F |
6.1.3 Malaysia Pest Control Products Market Revenues & Volume, By Chemical, 2022-2032F |
6.1.4 Malaysia Pest Control Products Market Revenues & Volume, By Mechanical, 2022-2032F |
6.1.5 Malaysia Pest Control Products Market Revenues & Volume, By Biological, 2022-2032F |
6.1.6 Malaysia Pest Control Products Market Revenues & Volume, By Others, 2022-2032F |
6.2 Malaysia Pest Control Products Market, By Pest type |
6.2.1 Overview and Analysis |
6.2.2 Malaysia Pest Control Products Market Revenues & Volume, By Insects, 2022-2032F |
6.2.3 Malaysia Pest Control Products Market Revenues & Volume, By Termites, 2022-2032F |
6.2.4 Malaysia Pest Control Products Market Revenues & Volume, By Rodents, 2022-2032F |
6.2.5 Malaysia Pest Control Products Market Revenues & Volume, By Others, 2022-2032F |
6.3 Malaysia Pest Control Products Market, By Application |
6.3.1 Overview and Analysis |
6.3.2 Malaysia Pest Control Products Market Revenues & Volume, By Commercial, 2022-2032F |
6.3.3 Malaysia Pest Control Products Market Revenues & Volume, By Residential, 2022-2032F |
6.3.4 Malaysia Pest Control Products Market Revenues & Volume, By Agriculture, 2022-2032F |
6.3.5 Malaysia Pest Control Products Market Revenues & Volume, By Industrial, 2022-2032F |
6.3.6 Malaysia Pest Control Products Market Revenues & Volume, By Others, 2022-2032F |
7 Malaysia Pest Control Products Market Import-Export Trade Statistics |
7.1 Malaysia Pest Control Products Market Export to Major Countries |
7.2 Malaysia Pest Control Products Market Imports from Major Countries |
8 Malaysia Pest Control Products Market Key Performance Indicators |
9 Malaysia Pest Control Products Market - Opportunity Assessment |
9.1 Malaysia Pest Control Products Market Opportunity Assessment, By Type, 2022 & 2032F |
9.2 Malaysia Pest Control Products Market Opportunity Assessment, By Pest type, 2022 & 2032F |
9.3 Malaysia Pest Control Products Market Opportunity Assessment, By Application, 2022 & 2032F |
10 Malaysia Pest Control Products Market - Competitive Landscape |
10.1 Malaysia Pest Control Products Market Revenue Share, By Companies, 2025 |
10.2 Malaysia Pest Control Products Market Competitive Benchmarking, By Operating and Technical Parameters |
11 Company Profiles |
12 Recommendations |
13 Disclaimer |
Global Go To Market Strategy - 2030
Export potential enables firms to identify high-growth global markets with greater confidence by combining advanced trade intelligence with a structured quantitative methodology. The framework analyzes emerging demand trends and country-level import patterns while integrating macroeconomic and trade datasets such as GDP and population forecasts, bilateral import–export flows, tariff structures, elasticity differentials between developed and developing economies, geographic distance, and import demand projections. Using weighted trade values from 2020–2024 as the base period to project country-to-country export potential for 2030, these inputs are operationalized through calculated drivers such as gravity model parameters, tariff impact factors, and projected GDP per-capita growth. Through an analysis of hidden potentials, demand hotspots, and market conditions that are most favorable to success, this method enables firms to focus on target countries, maximize returns, and global expansion with data, backed by accuracy.
By factoring in the projected importer demand gap that is currently unmet and could be potential opportunity, it identifies the potential for the Exporter (Country) among 190 countries, against the general trade analysis, which identifies the biggest importer or exporter.
To discover high-growth global markets and optimize your business strategy:
Click Here
Pricing
- Single User License$ 1,995
- Department License$ 2,400
- Site License$ 3,120
- Global License$ 3,795

Leadership Perspectives from Industry Events
Search
Thought Leadership and Analyst Meet


Our Clients
6WResearch In News
- India Air Conditioner Market Set for Strong Rebound in 2026 After Weather-Led Correction and GST-Driven Recovery: 6Wresearch
- ADAS in India: How Automatic Emergency Braking, Blind Spot Detection & Driver Monitoring are Transforming Road Safety
- Doha a strategic location for EV manufacturing hub: IPA Qatar
- Demand for luxury TVs surging in the GCC, says Samsung
- Empowering Growth: The Thriving Journey of Bangladesh’s Cable Industry
- Demand for luxury TVs surging in the GCC, says Samsung
Latest Reports
- Poland Fire Protection Systems Market (2026-2032)
- Cape Verde Portable Hand-Thrown Extinguisher Market (2026-2032)
- Canada Portable Hand-Thrown Extinguisher Market (2026-2032)
- Cameroon Portable Hand-Thrown Extinguisher Market (2026-2032)
- Burundi Portable Hand-Thrown Extinguisher Market (2026-2032)
- Burkina Faso Portable Hand-Thrown Extinguisher Market (2026-2032)
- Bulgaria Portable Hand-Thrown Extinguisher Market (2026-2032)
- Brunei Portable Hand-Thrown Extinguisher Market (2026-2032)
- Botswana Portable Hand-Thrown Extinguisher Market (2026-2032)
- Bosnia and Herzegovina Portable Hand-Thrown Extinguisher Market (2026-2032)
Industry Events and Analyst Meet

HIMTEX 2026

India Refining Summit 2026

India EV Show 2026

EV tech India Expo 2026

Auto Tech Asia 2026
Whitepaper
- Middle East & Africa Commercial Security Market Click here to view more.
- Middle East & Africa Fire Safety Systems & Equipment Market Click here to view more.
- GCC Drone Market Click here to view more.
- Middle East Lighting Fixture Market Click here to view more.
- GCC Physical & Perimeter Security Market Click here to view more.