New Zealand Blush Market (2025-2031) | Trends, Segmentation, Value, Industry, Growth, Forecast, Analysis, Companies, Revenue, Outlook, Size & Share
Market Forecast By Product Type (Lip Buccal, Cheek), By Application (Daily Use, Stage Makeup, Others) And Competitive Landscape
| Product Code: ETC5685410 | Publication Date: Nov 2023 | Updated Date: Nov 2025 | Product Type: Market Research Report | |
| Publisher: 6Wresearch | No. of Pages: 60 | No. of Figures: 30 | No. of Tables: 5 | |
New Zealand Blush Market Top 5 Importing Countries and Market Competition (HHI) Analysis
New Zealand`s blush import market in 2024 saw a diverse range of top exporting countries including the USA, China, Italy, Germany, and Australia. Despite the variety of sources, the market maintained low concentration with a Herfindahl-Hirschman Index (HHI) remaining stable. The compound annual growth rate (CAGR) from 2020 to 2024 reflects a steady increase of 3.72%, although there was a slight decline in the growth rate from 2023 to 2024 at -0.2%. This data suggests a resilient market with room for continued growth and potential for further diversification in the future.
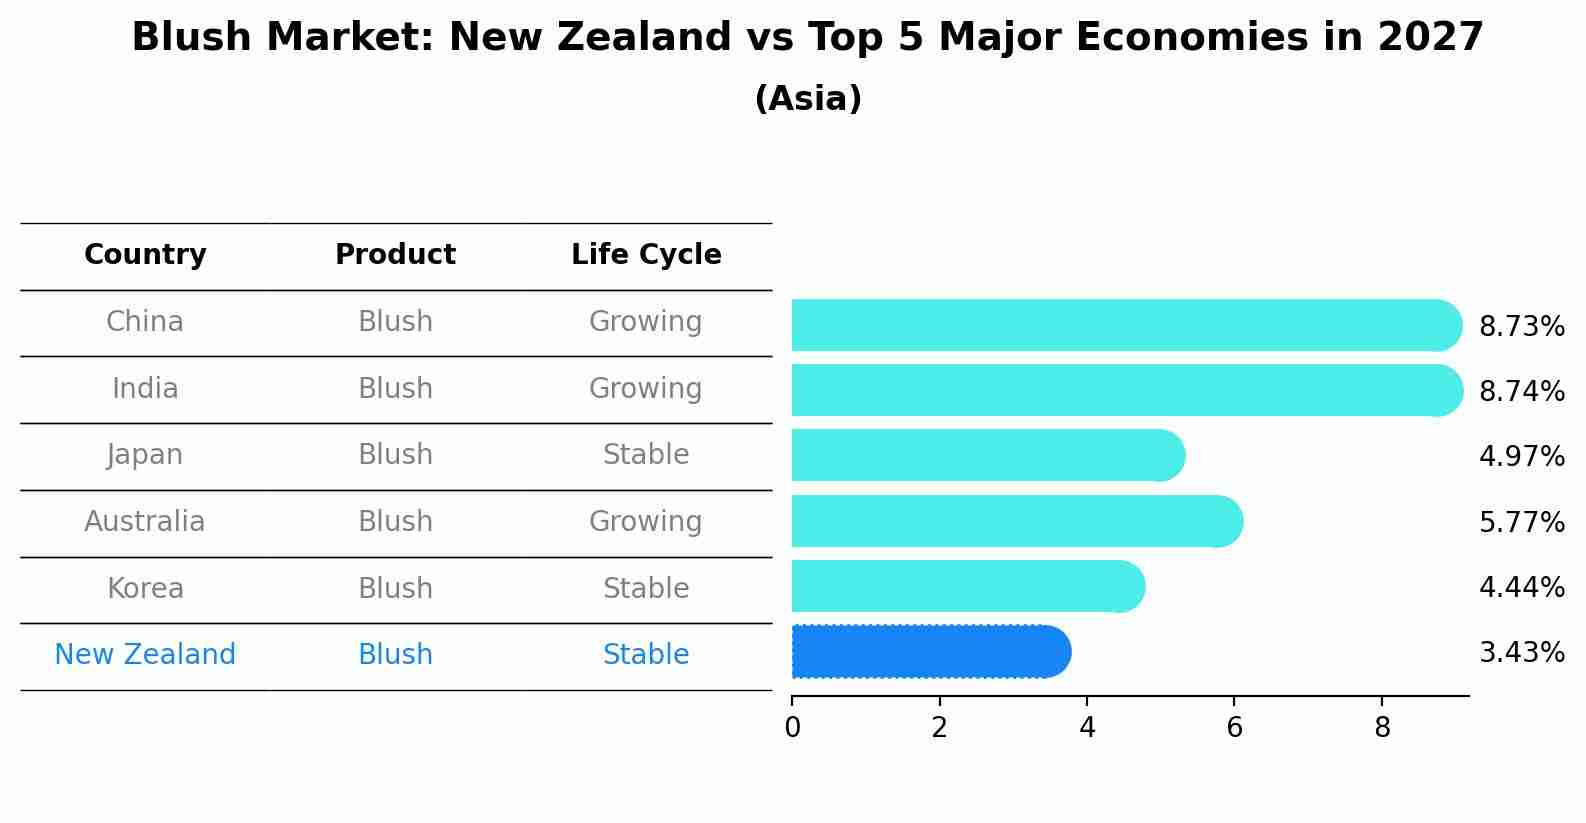
Blush Market: New Zealand vs Top 5 Major Economies in 2027 (Asia)
The Blush market in New Zealand is projected to grow at a stable growth rate of 3.43% by 2027, within the Asia region led by China, along with other countries like India, Japan, Australia and South Korea, collectively shaping a dynamic and evolving market environment driven by innovation and increasing adoption of emerging technologies.
Key Highlights of the Report:
- New Zealand Blush Market Outlook
- Market Size of New Zealand Blush Market, 2024
- Forecast of New Zealand Blush Market, 2031
- Historical Data and Forecast of New Zealand Blush Revenues & Volume for the Period 2021-2031
- New Zealand Blush Market Trend Evolution
- New Zealand Blush Market Drivers and Challenges
- New Zealand Blush Price Trends
- New Zealand Blush Porter`s Five Forces
- New Zealand Blush Industry Life Cycle
- Historical Data and Forecast of New Zealand Blush Market Revenues & Volume By Product Type for the Period 2021-2031
- Historical Data and Forecast of New Zealand Blush Market Revenues & Volume By Lip Buccal for the Period 2021-2031
- Historical Data and Forecast of New Zealand Blush Market Revenues & Volume By Cheek for the Period 2021-2031
- Historical Data and Forecast of New Zealand Blush Market Revenues & Volume By Application for the Period 2021-2031
- Historical Data and Forecast of New Zealand Blush Market Revenues & Volume By Daily Use for the Period 2021-2031
- Historical Data and Forecast of New Zealand Blush Market Revenues & Volume By Stage Makeup for the Period 2021-2031
- Historical Data and Forecast of New Zealand Blush Market Revenues & Volume By Others for the Period 2021-2031
- New Zealand Blush Import Export Trade Statistics
- Market Opportunity Assessment By Product Type
- Market Opportunity Assessment By Application
- New Zealand Blush Top Companies Market Share
- New Zealand Blush Competitive Benchmarking By Technical and Operational Parameters
- New Zealand Blush Company Profiles
- New Zealand Blush Key Strategic Recommendations
Frequently Asked Questions About the Market Study (FAQs):
6Wresearch actively monitors the New Zealand Blush Market and publishes its comprehensive annual report, highlighting emerging trends, growth drivers, revenue analysis, and forecast outlook. Our insights help businesses to make data-backed strategic decisions with ongoing market dynamics. Our analysts track relevent industries related to the New Zealand Blush Market, allowing our clients with actionable intelligence and reliable forecasts tailored to emerging regional needs.
Yes, we provide customisation as per your requirements. To learn more, feel free to contact us on sales@6wresearch.com
1 Executive Summary |
2 Introduction |
2.1 Key Highlights of the Report |
2.2 Report Description |
2.3 Market Scope & Segmentation |
2.4 Research Methodology |
2.5 Assumptions |
3 New Zealand Blush Market Overview |
3.1 New Zealand Country Macro Economic Indicators |
3.2 New Zealand Blush Market Revenues & Volume, 2021 & 2031F |
3.3 New Zealand Blush Market - Industry Life Cycle |
3.4 New Zealand Blush Market - Porter's Five Forces |
3.5 New Zealand Blush Market Revenues & Volume Share, By Product Type, 2021 & 2031F |
3.6 New Zealand Blush Market Revenues & Volume Share, By Application, 2021 & 2031F |
4 New Zealand Blush Market Dynamics |
4.1 Impact Analysis |
4.2 Market Drivers |
4.2.1 Increasing consumer preference for natural and organic beauty products |
4.2.2 Growing awareness about the benefits of using blush for enhancing facial features |
4.2.3 Rising disposable income leading to higher spending on cosmetics |
4.3 Market Restraints |
4.3.1 Fluctuating raw material prices affecting production costs |
4.3.2 Intense competition from established and new players in the market |
4.3.3 Changing consumer preferences towards minimalistic makeup looks |
5 New Zealand Blush Market Trends |
6 New Zealand Blush Market Segmentations |
6.1 New Zealand Blush Market, By Product Type |
6.1.1 Overview and Analysis |
6.1.2 New Zealand Blush Market Revenues & Volume, By Lip Buccal, 2021-2031F |
6.1.3 New Zealand Blush Market Revenues & Volume, By Cheek, 2021-2031F |
6.2 New Zealand Blush Market, By Application |
6.2.1 Overview and Analysis |
6.2.2 New Zealand Blush Market Revenues & Volume, By Daily Use, 2021-2031F |
6.2.3 New Zealand Blush Market Revenues & Volume, By Stage Makeup, 2021-2031F |
6.2.4 New Zealand Blush Market Revenues & Volume, By Others, 2021-2031F |
7 New Zealand Blush Market Import-Export Trade Statistics |
7.1 New Zealand Blush Market Export to Major Countries |
7.2 New Zealand Blush Market Imports from Major Countries |
8 New Zealand Blush Market Key Performance Indicators |
8.1 Social media engagement rate for blush-related content |
8.2 Number of new product launches in the blush segment |
8.3 Percentage of repeat purchases for blush products |
8.4 Average time spent by consumers in the blush product aisle in stores |
8.5 Consumer sentiment analysis on social media platforms regarding blush products |
9 New Zealand Blush Market - Opportunity Assessment |
9.1 New Zealand Blush Market Opportunity Assessment, By Product Type, 2021 & 2031F |
9.2 New Zealand Blush Market Opportunity Assessment, By Application, 2021 & 2031F |
10 New Zealand Blush Market - Competitive Landscape |
10.1 New Zealand Blush Market Revenue Share, By Companies, 2024 |
10.2 New Zealand Blush Market Competitive Benchmarking, By Operating and Technical Parameters |
11 Company Profiles |
12 Recommendations | 13 Disclaimer |
Pricing
- Single User License$ 1,995
- Department License$ 2,400
- Site License$ 3,120
- Global License$ 3,795

Search
Related Reports
- Vietnam System Integrator Market (2025-2031) | Size, Companies, Analysis, Industry, Value, Forecast, Growth, Trends, Revenue & Share
- ASEAN and Thailand Brain Health Supplements Market (2025-2031) | Strategy, Consumer Insights, Analysis, Investment Trends, Opportunities, Growth, Size, Share, Industry, Revenue, Segments, Value, Segmentation, Supply, Forecast, Restraints, Outlook, Competition, Drivers, Trends, Demand, Pricing Analysis, Competitive, Strategic Insights, Companies, Challenges
- ASEAN Bearings Market (2025-2031) | Strategy, Consumer Insights, Analysis, Investment Trends, Opportunities, Growth, Size, Share, Industry, Revenue, Segments, Value, Segmentation, Supply, Forecast, Restraints, Outlook, Competition, Drivers, Trends, Demand, Pricing Analysis, Competitive, Strategic Insights, Companies, Challenges
- Europe Flooring Market (2025-2031) | Outlook, Share, Industry, Trends, Forecast, Companies, Revenue, Size, Analysis, Growth & Value
- Saudi Arabia Manlift Market (2025-2031) | Outlook, Size, Growth, Trends, Companies, Industry, Revenue, Value, Share, Forecast & Analysis
- Uganda Excavator, Crane, and Wheel Loaders Market (2025-2031) | Strategy, Consumer Insights, Analysis, Investment Trends, Opportunities, Growth, Size, Share, Industry, Revenue, Segments, Value, Segmentation, Supply, Forecast, Restraints, Outlook, Competition, Drivers, Trends, Demand, Pricing Analysis, Competitive, Strategic Insights, Companies, Challenges
- Rwanda Excavator, Crane, and Wheel Loaders Market (2025-2031) | Strategy, Consumer Insights, Analysis, Investment Trends, Opportunities, Growth, Size, Share, Industry, Revenue, Segments, Value, Segmentation, Supply, Forecast, Restraints, Outlook, Competition, Drivers, Trends, Demand, Pricing Analysis, Competitive, Strategic Insights, Companies, Challenges
- Kenya Excavator, Crane, and Wheel Loaders Market (2025-2031) | Strategy, Consumer Insights, Analysis, Investment Trends, Opportunities, Growth, Size, Share, Industry, Revenue, Segments, Value, Segmentation, Supply, Forecast, Restraints, Outlook, Competition, Drivers, Trends, Demand, Pricing Analysis, Competitive, Strategic Insights, Companies, Challenges
- Angola Excavator, Crane, and Wheel Loaders Market (2025-2031) | Strategy, Consumer Insights, Analysis, Investment Trends, Opportunities, Growth, Size, Share, Industry, Revenue, Segments, Value, Segmentation, Supply, Forecast, Restraints, Outlook, Competition, Drivers, Trends, Demand, Pricing Analysis, Competitive, Strategic Insights, Companies, Challenges
- Israel Intelligent Transport System Market (2025-2031) | Strategy, Consumer Insights, Analysis, Investment Trends, Opportunities, Growth, Size, Share, Industry, Revenue, Segments, Value, Segmentation, Supply, Forecast, Restraints, Outlook, Competition, Drivers, Trends, Demand, Pricing Analysis, Competitive, Strategic Insights, Companies, Challenges
Industry Events and Analyst Meet

Smart Home Expo 2026

Industrial Facilities Management Expo 2025

4th Edition India Energy Conclave 2025

Media Expo 2025

Gas India Expo 2025
Our Clients
Whitepaper
- Middle East & Africa Commercial Security Market Click here to view more.
- Middle East & Africa Fire Safety Systems & Equipment Market Click here to view more.
- GCC Drone Market Click here to view more.
- Middle East Lighting Fixture Market Click here to view more.
- GCC Physical & Perimeter Security Market Click here to view more.
6WResearch In News
- Doha a strategic location for EV manufacturing hub: IPA Qatar
- Demand for luxury TVs surging in the GCC, says Samsung
- Empowering Growth: The Thriving Journey of Bangladesh’s Cable Industry
- Demand for luxury TVs surging in the GCC, says Samsung
- Video call with a traditional healer? Once unthinkable, it’s now common in South Africa
- Intelligent Buildings To Smooth GCC’s Path To Net Zero