Peru Non-alcoholic Drink Market (2020-2026) | Size, Industry, Value, Trends, Revenue, Analysis, Forecast, Share, COVID-19 IMPACT, Outlook, Companies & Growth
Market Forecast By Product Types (CarbonatedDrinks, Non-CarbonatedDrinks ), By Distribution Channel (Online, Offline) And Competitive Landscape
| Product Code: ETC024986 | Publication Date: Jun 2023 | Updated Date: Nov 2025 | Product Type: Report | |
| Publisher: 6Wresearch | Author: Ravi Bhandari | No. of Pages: 70 | No. of Figures: 35 | No. of Tables: 5 |
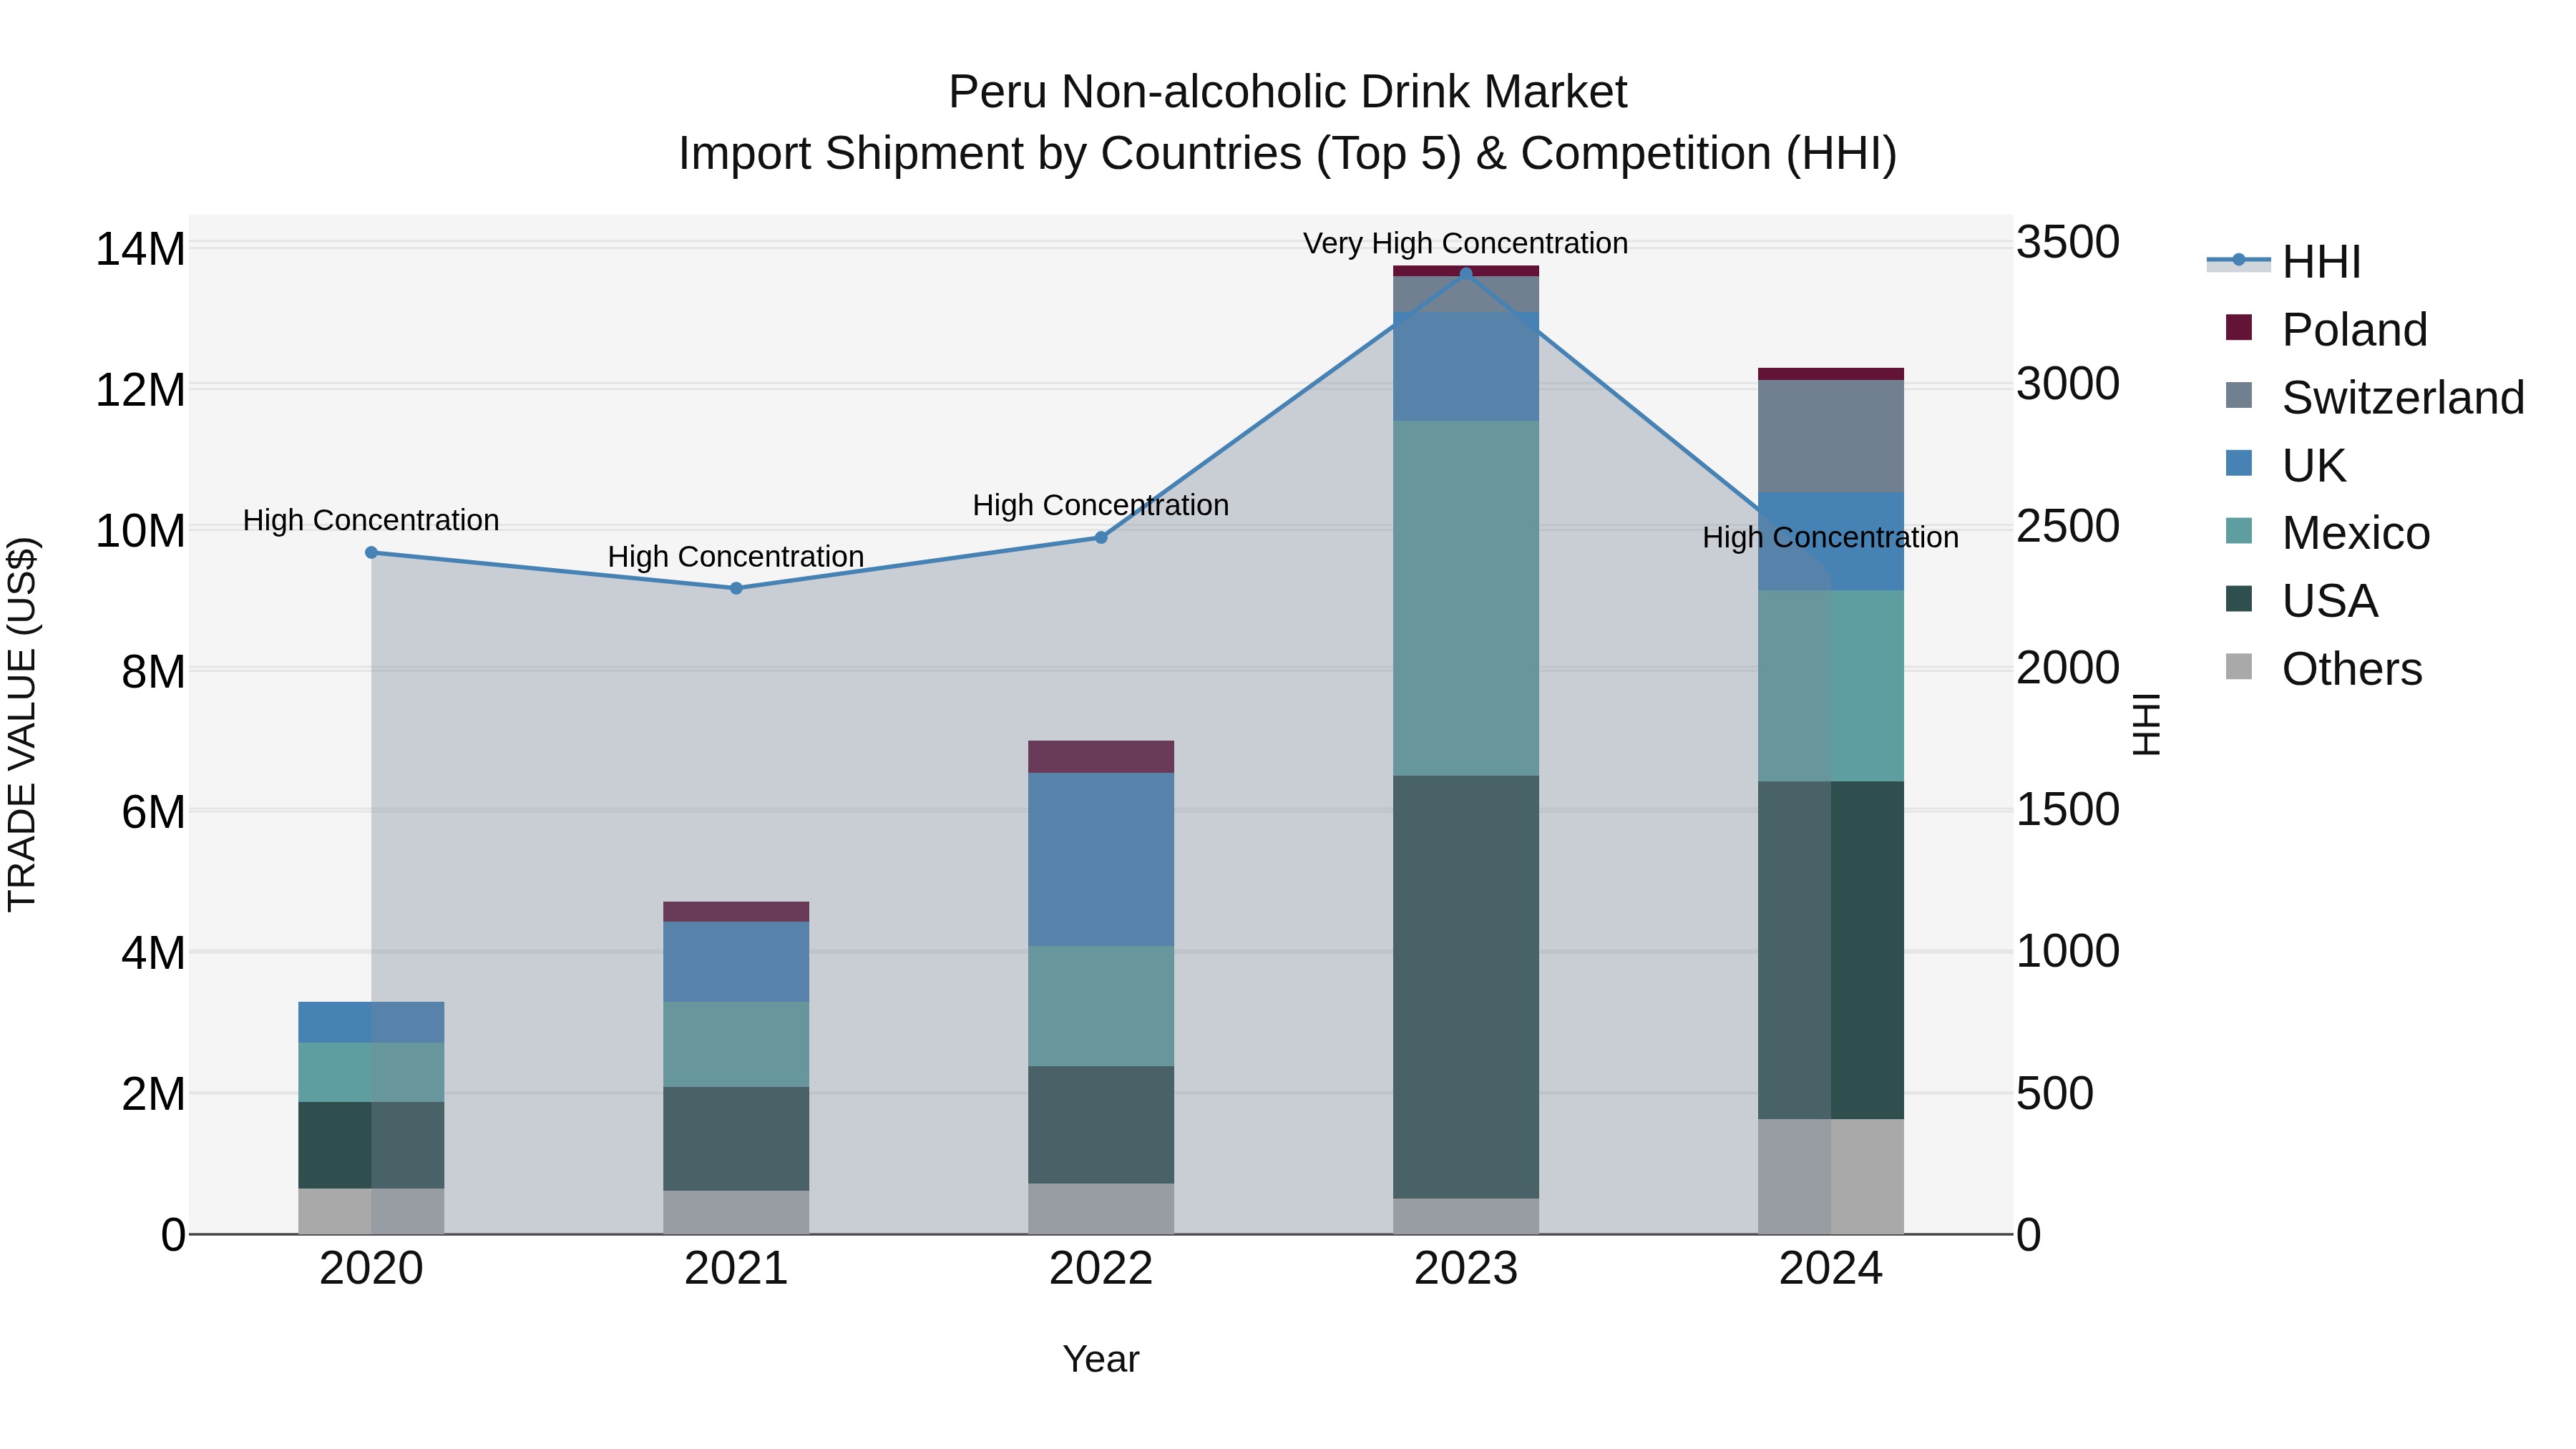
Peru Non Alcoholic Drink Market Top 5 Importing Countries and Market Competition (HHI) Analysis
Peru`s non-alcoholic drink import market saw a shift in concentration levels in 2024, moving from very high to high concentration. The top exporting countries to Peru in 2024 were the USA, Mexico, Switzerland, UK, and Chile. Despite a negative growth rate of -10.57% in 2024, the compound annual growth rate (CAGR) from 2020 to 2024 remained impressive at 38.97%. This indicates a dynamic market with fluctuations in growth patterns, suggesting opportunities for further market analysis and strategic planning for non-alcoholic drink importers targeting Peru.
Peru Export Potential Assessment For Non-alcoholic Drink Market (Values in USD Thousand)
Peru Non Alcoholic Drink Market Synopsis
Peru is one of the fastest growing markets for non-alcoholic drinks in South America. In 2020, Peru`s retail value sales for non-alcoholic drinks increased by 6% compared to 2019, reaching US$3.7 billion. The category continued to be driven by strong performances from juice, carbonates and bottled water which accounted for 45%, 24%, and 15% respectively of total retail value sales during 2020. Non-alcoholic tea also saw growth with a 3% increase in retail value sales over the same period due to rising health consciousness among consumers that sparked an interest in healthier alternatives such as green tea and herbal infusions. Moreover, energy drinks grew by 5% due to their convenience which enabled them to capitalize on the increasing demand for impulse purchases within convenience stores while soft drink concentrates was up 4%. These positives were only offset slightly by declining performance from RTD coffee (-1%) due to competition from alternative options such as RTD tea or iced coffees found in caf?s or restaurants.
Key Highlights of the Report:
- Peru Non-alcoholic Drink Market Outlook
- Market Size of Peru Non-alcoholic Drink Market, 2019
- Forecast of Peru Non-alcoholic Drink Market, 2026
- Historical Data and Forecast of Peru Non-alcoholic Drink Revenues & Volume for the Period 2016 - 2026
- Peru Non-alcoholic Drink Market Trend Evolution
- Peru Non-alcoholic Drink Market Drivers and Challenges
- Peru Non-alcoholic Drink Price Trends
- Peru Non-alcoholic Drink Porter's Five Forces
- Peru Non-alcoholic Drink Industry Life Cycle
- Historical Data and Forecast of Peru Non-alcoholic Drink Market Revenues & Volume By Product Types for the Period 2016 - 2026
- Historical Data and Forecast of Peru Non-alcoholic Drink Market Revenues & Volume By Carbonated Drinks for the Period 2016 - 2026
- Historical Data and Forecast of Peru Non-alcoholic Drink Market Revenues & Volume By Non-Carbonated Drinks for the Period 2016 - 2026
- Historical Data and Forecast of Peru Non-alcoholic Drink Market Revenues & Volume By Distribution Channel for the Period 2016 - 2026
- Historical Data and Forecast of Peru Non-alcoholic Drink Market Revenues & Volume By Online for the Period 2016 - 2026
- Historical Data and Forecast of Peru Non-alcoholic Drink Market Revenues & Volume By Offline for the Period 2016 - 2026
- Peru Non-alcoholic Drink Import Export Trade Statistics
- Market Opportunity Assessment By Product Types
- Market Opportunity Assessment By Distribution Channel
- Peru Non-alcoholic Drink Top Companies Market Share
- Peru Non-alcoholic Drink Competitive Benchmarking By Technical and Operational Parameters
- Peru Non-alcoholic Drink Company Profiles
- Peru Non-alcoholic Drink Key Strategic Recommendations
Frequently Asked Questions About the Market Study (FAQs):
6Wresearch actively monitors the Peru Non-alcoholic Drink Market and publishes its comprehensive annual report, highlighting emerging trends, growth drivers, revenue analysis, and forecast outlook. Our insights help businesses to make data-backed strategic decisions with ongoing market dynamics. Our analysts track relevent industries related to the Peru Non-alcoholic Drink Market, allowing our clients with actionable intelligence and reliable forecasts tailored to emerging regional needs.
Yes, we provide customisation as per your requirements. To learn more, feel free to contact us on sales@6wresearch.com
1 Executive Summary |
2 Introduction |
2.1 Key Highlights of the Report |
2.2 Report Description |
2.3 Market Scope & Segmentation |
2.4 Research Methodology |
2.5 Assumptions |
3 Peru Non-alcoholic Drink Market Overview |
3.1 Peru Country Macro Economic Indicators |
3.2 Peru Non-alcoholic Drink Market Revenues & Volume, 2019 & 2026F |
3.3 Peru Non-alcoholic Drink Market - Industry Life Cycle |
3.4 Peru Non-alcoholic Drink Market - Porter's Five Forces |
3.5 Peru Non-alcoholic Drink Market Revenues & Volume Share, By Product Types, 2019 & 2026F |
3.6 Peru Non-alcoholic Drink Market Revenues & Volume Share, By Distribution Channel, 2019 & 2026F |
4 Peru Non-alcoholic Drink Market Dynamics |
4.1 Impact Analysis |
4.2 Market Drivers |
4.2.1 Increasing health consciousness among consumers |
4.2.2 Growing demand for natural and organic beverages |
4.2.3 Rising disposable income leading to higher spending on beverages |
4.3 Market Restraints |
4.3.1 Competition from alcoholic beverages |
4.3.2 Price fluctuations of raw materials |
4.3.3 Changing consumer preferences towards other beverage options |
5 Peru Non-alcoholic Drink Market Trends |
6 Peru Non-alcoholic Drink Market, By Types |
6.1 Peru Non-alcoholic Drink Market, By Product Types |
6.1.1 Overview and Analysis |
6.1.2 Peru Non-alcoholic Drink Market Revenues & Volume, By Product Types, 2016 - 2026F |
6.1.3 Peru Non-alcoholic Drink Market Revenues & Volume, By Carbonated Drinks, 2016 - 2026F |
6.1.4 Peru Non-alcoholic Drink Market Revenues & Volume, By Non-Carbonated Drinks , 2016 - 2026F |
6.2 Peru Non-alcoholic Drink Market, By Distribution Channel |
6.2.1 Overview and Analysis |
6.2.2 Peru Non-alcoholic Drink Market Revenues & Volume, By Online, 2016 - 2026F |
6.2.3 Peru Non-alcoholic Drink Market Revenues & Volume, By Offline, 2016 - 2026F |
7 Peru Non-alcoholic Drink Market Import-Export Trade Statistics |
7.1 Peru Non-alcoholic Drink Market Export to Major Countries |
7.2 Peru Non-alcoholic Drink Market Imports from Major Countries |
8 Peru Non-alcoholic Drink Market Key Performance Indicators |
8.1 Market penetration rate of new non-alcoholic drink products |
8.2 Consumer engagement on social media platforms |
8.3 Percentage of sales from innovative product offerings |
8.4 Number of distribution channels expanded |
8.5 Growth in online sales for non-alcoholic beverages |
9 Peru Non-alcoholic Drink Market - Opportunity Assessment |
9.1 Peru Non-alcoholic Drink Market Opportunity Assessment, By Product Types, 2019 & 2026F |
9.2 Peru Non-alcoholic Drink Market Opportunity Assessment, By Distribution Channel, 2019 & 2026F |
10 Peru Non-alcoholic Drink Market - Competitive Landscape |
10.1 Peru Non-alcoholic Drink Market Revenue Share, By Companies, 2019 |
10.2 Peru Non-alcoholic Drink Market Competitive Benchmarking, By Operating and Technical Parameters |
11 Company Profiles |
12 Recommendations |
13 Disclaimer |
Export potential assessment - trade Analytics for 2030
Export potential enables firms to identify high-growth global markets with greater confidence by combining advanced trade intelligence with a structured quantitative methodology. The framework analyzes emerging demand trends and country-level import patterns while integrating macroeconomic and trade datasets such as GDP and population forecasts, bilateral import–export flows, tariff structures, elasticity differentials between developed and developing economies, geographic distance, and import demand projections. Using weighted trade values from 2020–2024 as the base period to project country-to-country export potential for 2030, these inputs are operationalized through calculated drivers such as gravity model parameters, tariff impact factors, and projected GDP per-capita growth. Through an analysis of hidden potentials, demand hotspots, and market conditions that are most favorable to success, this method enables firms to focus on target countries, maximize returns, and global expansion with data, backed by accuracy.
By factoring in the projected importer demand gap that is currently unmet and could be potential opportunity, it identifies the potential for the Exporter (Country) among 190 countries, against the general trade analysis, which identifies the biggest importer or exporter.
To discover high-growth global markets and optimize your business strategy:
Click Here
Pricing
- Single User License$ 1,995
- Department License$ 2,400
- Site License$ 3,120
- Global License$ 3,795

Search
Thought Leadership and Analyst Meet


Our Clients
Latest Reports
- Taiwan Food Delivery Platform Market (2026-2032) | Companies, Outlook, Analysis, Trends, Value, Revenue, Segmentation, Share, Forecast, Competitive Landscape, Growth, Size & Forecast
- United Kingdom (UK) Long-term Care Insurance Market (2026-2032) | Growth, Share, Consumer Insights, Drivers, Opportunities, Competition, Pricing Analysis, Segments, Restraints, Companies, Competitive, Value, Outlook, Size, Demand, Analysis, Challenges, Strategic Insights, Investment Trends, Revenue, Trends, Supply, Forecast
- United Kingdom (UK) Long Term Care Market (2026-2032) | Companies, Outlook, Analysis, Trends, Value, Revenue, Segmentation, Share, Forecast, Competitive Landscape, Growth, Size & Forecast
- Iraq Insulation and Waterproofing Market (2026-2032) | Outlook, Drivers, Growth, Size, Share, Industry, Revenue, Trends, Demand, Competitive, Strategic Insights, Opportunities, Segments, Companies, Challenges, Strategy, Consumer Insights, Analysis, Investment Trends, Value, Segmentation, Forecast, Restraints
- India Switchgear Market Outlook (2026-2032) | Size, Share, Trends, Growth, Revenue, Forecast, Analysis, Value, Outlook
- Pakistan Contraceptive Implants Market (2025-2031) | Demand, Growth, Size, Share, Industry, Pricing Analysis, Competitive, Strategic Insights, Strategy, Consumer Insights, Analysis, Investment Trends, Opportunities, Revenue, Segments, Value, Segmentation, Supply, Forecast, Restraints, Outlook, Competition, Drivers, Trends, Companies, Challenges
- Sri Lanka Packaging Market (2026-2032) | Outlook, Competition, Drivers, Trends, Demand, Pricing Analysis, Competitive, Strategic Insights, Companies, Challenges, Strategy, Consumer Insights, Analysis, Investment Trends, Opportunities, Growth, Size, Share, Industry, Revenue, Segments, Value, Segmentation, Supply, Forecast, Restraints
- India Kids Watches Market (2026-2032) | Strategy, Consumer Insights, Analysis, Investment Trends, Opportunities, Growth, Size, Share, Industry, Revenue, Segments, Value, Segmentation, Supply, Forecast, Restraints, Outlook, Competition, Drivers, Trends, Demand, Pricing Analysis, Competitive, Strategic Insights, Companies, Challenges
- Saudi Arabia Core Assurance Service Market (2025-2031) | Strategy, Consumer Insights, Analysis, Investment Trends, Opportunities, Growth, Size, Share, Industry, Revenue, Segments, Value, Segmentation, Supply, Forecast, Restraints, Outlook, Competition, Drivers, Trends, Demand, Pricing Analysis, Competitive, Strategic Insights, Companies, Challenges
- Romania Uninterruptible Power Supply (UPS) Market (2026-2032) | Industry, Analysis, Revenue, Size, Forecast, Outlook, Value, Trends, Share, Growth & Companies
Industry Events and Analyst Meet

India EV Show 2026

EV tech India Expo 2026

Auto Tech Asia 2026

Battery Tech India 2026

Smart Production Solutions Guangzhou 2026
Whitepaper
- Middle East & Africa Commercial Security Market Click here to view more.
- Middle East & Africa Fire Safety Systems & Equipment Market Click here to view more.
- GCC Drone Market Click here to view more.
- Middle East Lighting Fixture Market Click here to view more.
- GCC Physical & Perimeter Security Market Click here to view more.
6WResearch In News
- Doha a strategic location for EV manufacturing hub: IPA Qatar
- Demand for luxury TVs surging in the GCC, says Samsung
- Empowering Growth: The Thriving Journey of Bangladesh’s Cable Industry
- Demand for luxury TVs surging in the GCC, says Samsung
- Video call with a traditional healer? Once unthinkable, it’s now common in South Africa
- Intelligent Buildings To Smooth GCC’s Path To Net Zero