Poland Metals Service Centers Market (2026-2032) | Revenue, Industry, Value, Share, Size, Outlook, Trends, Growth, Forecast, Companies, COVID-19 IMPACT & Analysis
Market Forecast By Type (Aluminum, Stainless Steel, Carbon, Alloy, Others), By Applications (Building and Infrastructure, Mechanical and Electrica Equipment, Transport, Metal Products, Others) And Competitive Landscape
| Product Code: ETC036335 | Publication Date: Jun 2023 | Updated Date: Jun 2026 | Product Type: Report | |
| Publisher: 6Wresearch | Author: Ravi Bhandari | No. of Pages: 70 | No. of Figures: 35 | No. of Tables: 5 |
Poland Metals Service Centers Market Summary
The poland metals service centers market was estimated at USD 1099 Million in 2025 and is projected to reach USD 1597 Million by 2032, growing at a CAGR of 6.4% from 2026 to 2032.
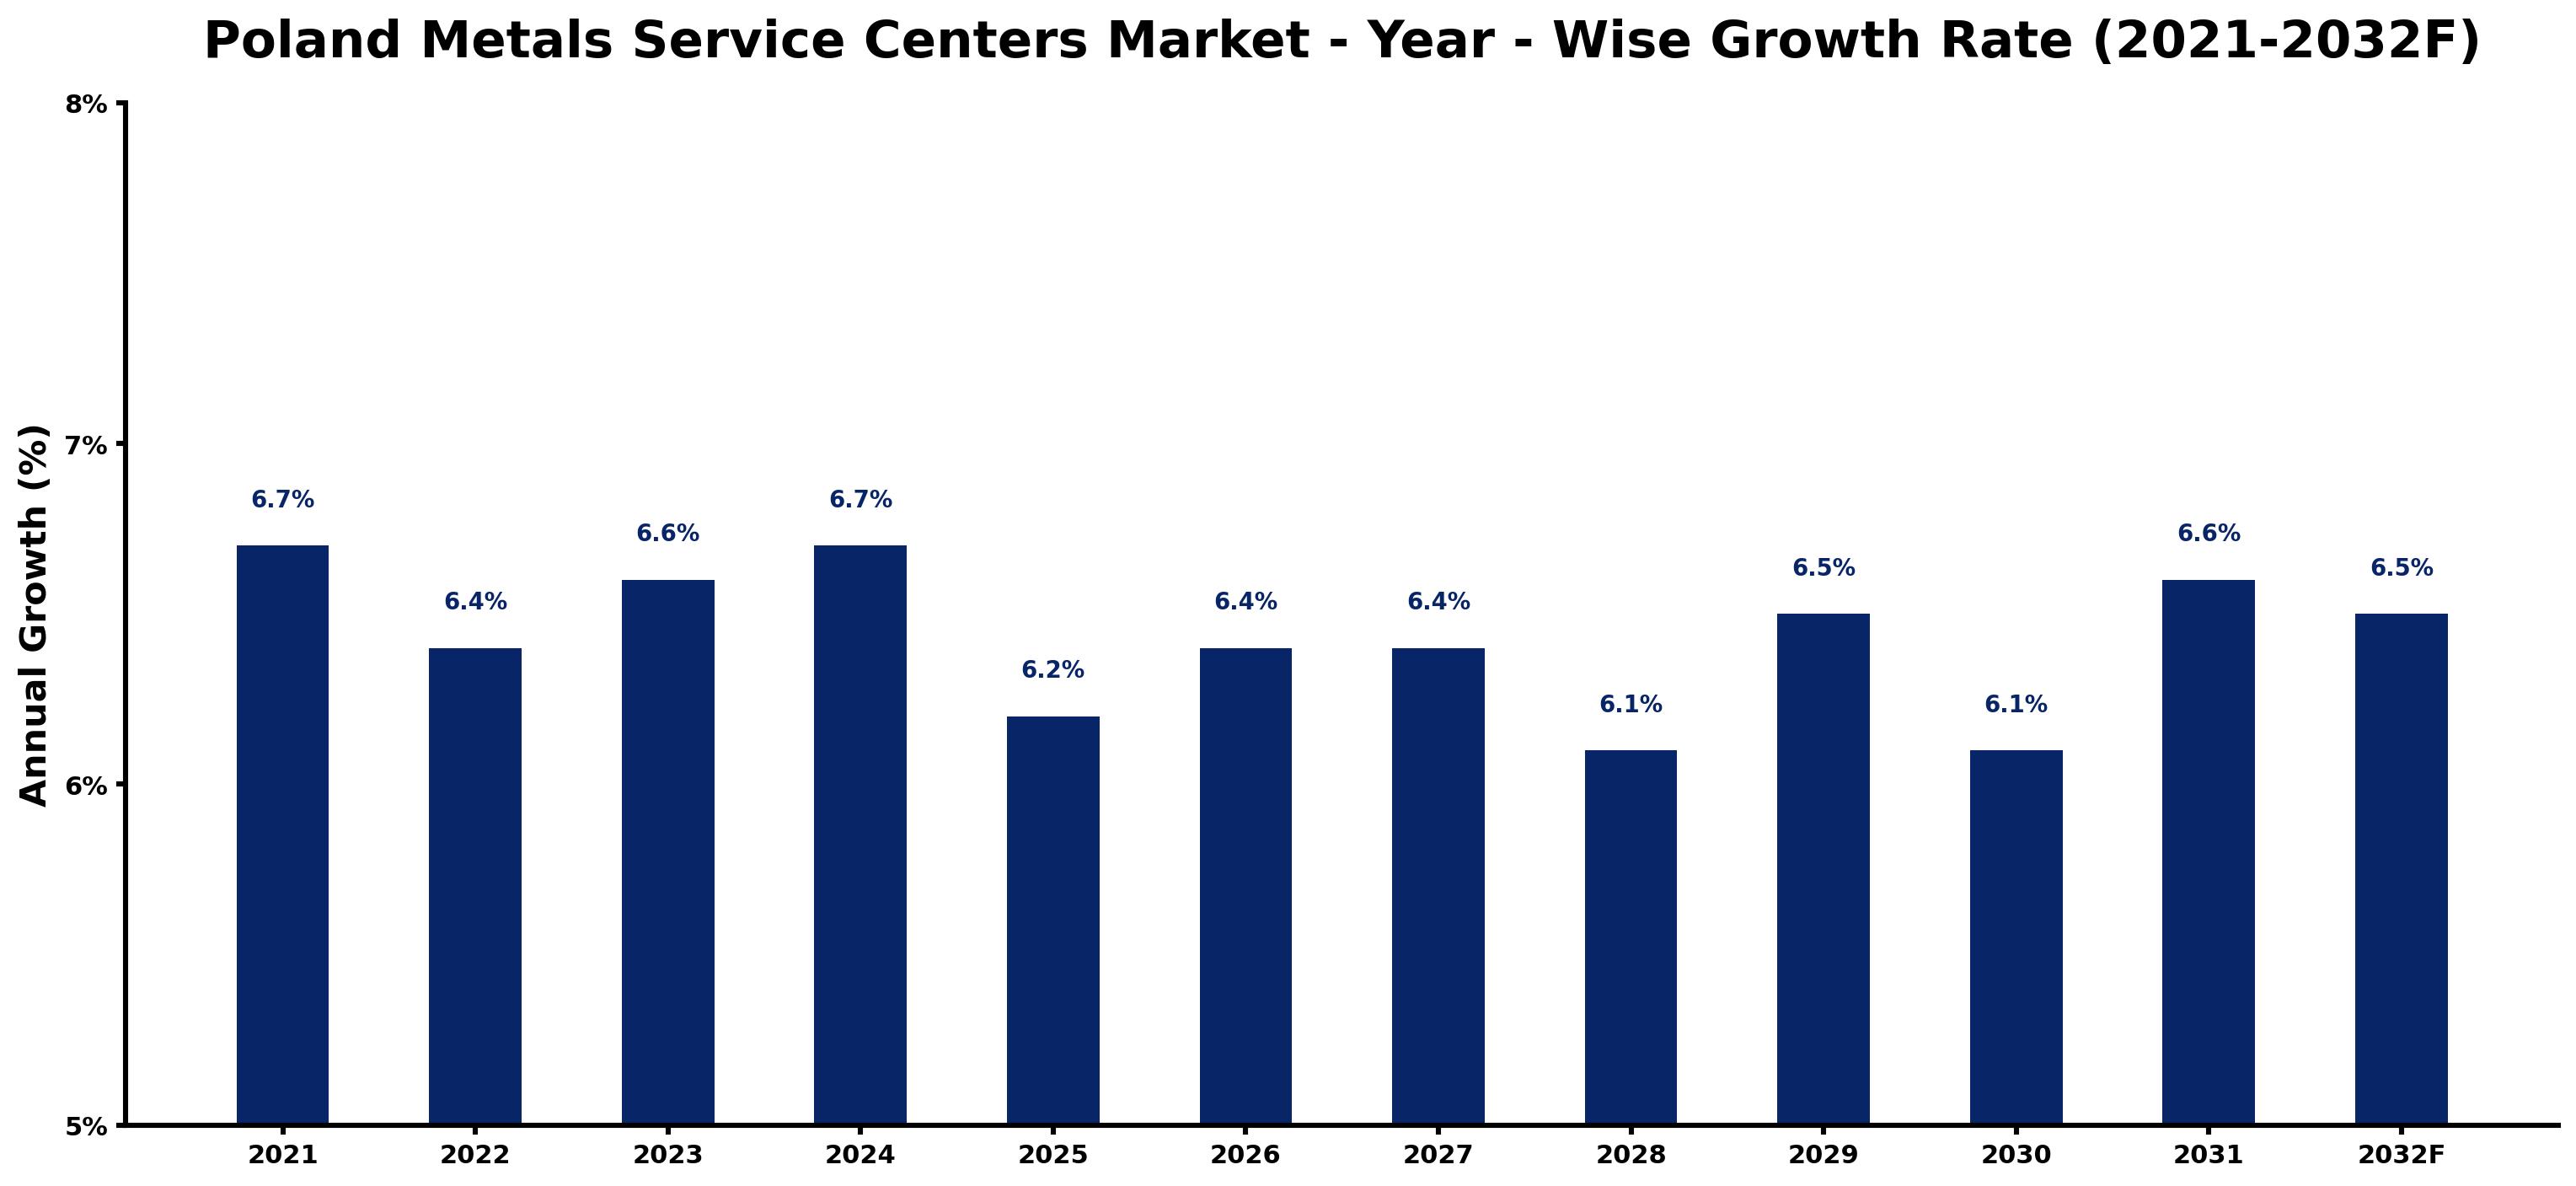
Poland Metals Service Centers Market Growth Rate Analysis (2021-2032)
The Poland Metals Service Centers market has demonstrated stable growth, marked by a yearly increase of 6.7% in 2021 and 2022, followed by a slight dip to 6.4% in 2023. This resilience is attributed to escalating demand across various sectors, propelled by robust industrial activity and ongoing investments in infrastructure. Notably, as the country advances towards energy transition, there is a growing reliance on metals for sustainable technologies, fueling further expansion. With growth rates stabilizing around 6.1% to 6.7% through 2032, fluctuations can be linked to shifting consumer preferences and the seemingly continual push for digitalization, which shapes operational efficiencies across service centers.
Poland Metals Service Centers Market Year-wise Growth Rate and Key Drivers
This graph highlights how the Poland Metals Service Centers Market has steadily grown over the past five years, supported by major growth factors.
The table below presents the year wise growth rates along with the key drivers influencing the market
| Year | Growth Rate | Major Drivers |
| 2021 | 6.7% | Post-lockdown recovery led to increased production activity in various sectors. |
| 2022 | 6.4% | Manufacturing sector investments highlighted the need for enhanced metal service solutions. |
| 2023 | 6.6% | Emerging green technologies prompted shifts in demand for specific metal compositions. |
| 2024 | 6.7% | Local manufacturers pursued supply chain resilience strategies, increasing metal stockpiling. |
| 2025 | 6.2% | Transitioning toward electric vehicles stimulated higher demands for specialized metal processing. |
| 2026 | 6.4% | Construction industry expansion necessitated reliable access to high-quality metal products. |
| 2027 | 6.4% | Regional economic stability encouraged foreign investments in Poland's manufacturing capabilities. |
| 2028 | 6.1% | Technological upgrades within service centers improved efficiency and reduced operational costs. |
| 2029 | 6.5% | Sustainability initiatives gained traction, influencing metal selection and processing methods. |
| 2030 | 6.1% | Corporate mergers within the sector streamlined operations and enhanced market competitiveness. |
| 2031 | 6.6% | Digital transformation trends reshaped customer engagement with metal service offerings. |
| 2032 | 6.5% | Global supply chain shifts resulted in localized sourcing preferences and market adaptations. |
Note - Market size estimations and growth projections presented in this report are based on 6Wresearch's advanced forecasting approach, validated with industry datasets as of June 2026.
Key Highlights of the Report:
- Poland Metals Service Centers Market Outlook
- Market Size of Poland Metals Service Centers Market, 2025
- Forecast of Poland Metals Service Centers Market, 2023F
- Historical Data and Forecast of Poland Metals Service Centers Revenues & Volume for the Period 2022-2032F
- Poland Metals Service Centers Market Trend Evolution
- Poland Metals Service Centers Market Drivers and Challenges
- Poland Metals Service Centers Price Trends
- Poland Metals Service Centers Porter's Five Forces
- Poland Metals Service Centers Industry Life Cycle
- Historical Data and Forecast of Poland Metals Service Centers Market Revenues & Volume By Type for the Period 2022-2032F
- Historical Data and Forecast of Poland Metals Service Centers Market Revenues & Volume By Aluminum for the Period 2022-2032F
- Historical Data and Forecast of Poland Metals Service Centers Market Revenues & Volume By Stainless Steel for the Period 2022-2032F
- Historical Data and Forecast of Poland Metals Service Centers Market Revenues & Volume By Carbon for the Period 2022-2032F
- Historical Data and Forecast of Poland Metals Service Centers Market Revenues & Volume By Alloy for the Period 2022-2032F
- Historical Data and Forecast of Poland Metals Service Centers Market Revenues & Volume By Others for the Period 2022-2032F
- Historical Data and Forecast of Poland Metals Service Centers Market Revenues & Volume By Applications for the Period 2022-2032F
- Historical Data and Forecast of Poland Metals Service Centers Market Revenues & Volume By Building and Infrastructure for the Period 2022-2032F
- Historical Data and Forecast of Poland Metals Service Centers Market Revenues & Volume By Mechanical and Electrica Equipment for the Period 2022-2032F
- Historical Data and Forecast of Poland Metals Service Centers Market Revenues & Volume By Transport for the Period 2022-2032F
- Historical Data and Forecast of Poland Metals Service Centers Market Revenues & Volume By Metal Products for the Period 2022-2032F
- Historical Data and Forecast of Poland Metals Service Centers Market Revenues & Volume By Others for the Period 2022-2032F
- Poland Metals Service Centers Import Export Trade Statistics
- Market Opportunity Assessment By Type
- Market Opportunity Assessment By Applications
- Poland Metals Service Centers Top Companies Market Share
- Poland Metals Service Centers Competitive Benchmarking By Technical and Operational Parameters
- Poland Metals Service Centers Company Profiles
- Poland Metals Service Centers Key Strategic Recommendations
Frequently Asked Questions About the Market Study (FAQs):
6Wresearch actively monitors the Poland Metals Service Centers Market and publishes its comprehensive annual report, highlighting emerging trends, growth drivers, revenue analysis, and forecast outlook. Our insights help businesses to make data-backed strategic decisions with ongoing market dynamics. Our analysts track relevent industries related to the Poland Metals Service Centers Market, allowing our clients with actionable intelligence and reliable forecasts tailored to emerging regional needs.
Yes, we provide customisation as per your requirements. To learn more, feel free to contact us on sales@6wresearch.com
1 Executive Summary |
2 Introduction |
2.1 Key Highlights of the Report |
2.2 Report Description |
2.3 Market Scope & Segmentation |
2.4 Research Methodology |
2.5 Assumptions |
3 Poland Metals Service Centers Market Overview |
3.1 Poland Country Macro Economic Indicators |
3.2 Poland Metals Service Centers Market Revenues & Volume, 2022 & 2032F |
3.3 Poland Metals Service Centers Market - Industry Life Cycle |
3.4 Poland Metals Service Centers Market - Porter's Five Forces |
3.5 Poland Metals Service Centers Market Revenues & Volume Share, By Type, 2022 & 2032F |
3.6 Poland Metals Service Centers Market Revenues & Volume Share, By Applications, 2022 & 2032F |
4 Poland Metals Service Centers Market Dynamics |
4.1 Impact Analysis |
4.2 Market Drivers |
4.3 Market Restraints |
5 Poland Metals Service Centers Market Trends |
6 Poland Metals Service Centers Market, By Types |
6.1 Poland Metals Service Centers Market, By Type |
6.1.1 Overview and Analysis |
6.1.2 Poland Metals Service Centers Market Revenues & Volume, By Type, 2016 - 2026F |
6.1.3 Poland Metals Service Centers Market Revenues & Volume, By Aluminum, 2016 - 2026F |
6.1.4 Poland Metals Service Centers Market Revenues & Volume, By Stainless Steel, 2016 - 2026F |
6.1.5 Poland Metals Service Centers Market Revenues & Volume, By Carbon, 2016 - 2026F |
6.1.6 Poland Metals Service Centers Market Revenues & Volume, By Alloy, 2016 - 2026F |
6.1.7 Poland Metals Service Centers Market Revenues & Volume, By Others, 2016 - 2026F |
6.2 Poland Metals Service Centers Market, By Applications |
6.2.1 Overview and Analysis |
6.2.2 Poland Metals Service Centers Market Revenues & Volume, By Building and Infrastructure, 2016 - 2026F |
6.2.3 Poland Metals Service Centers Market Revenues & Volume, By Mechanical and Electrica Equipment, 2016 - 2026F |
6.2.4 Poland Metals Service Centers Market Revenues & Volume, By Transport, 2016 - 2026F |
6.2.5 Poland Metals Service Centers Market Revenues & Volume, By Metal Products, 2016 - 2026F |
6.2.6 Poland Metals Service Centers Market Revenues & Volume, By Others, 2016 - 2026F |
7 Poland Metals Service Centers Market Import-Export Trade Statistics |
7.1 Poland Metals Service Centers Market Export to Major Countries |
7.2 Poland Metals Service Centers Market Imports from Major Countries |
8 Poland Metals Service Centers Market Key Performance Indicators |
9 Poland Metals Service Centers Market - Opportunity Assessment |
9.1 Poland Metals Service Centers Market Opportunity Assessment, By Type, 2022 & 2032F |
9.2 Poland Metals Service Centers Market Opportunity Assessment, By Applications, 2022 & 2032F |
10 Poland Metals Service Centers Market - Competitive Landscape |
10.1 Poland Metals Service Centers Market Revenue Share, By Companies, 2019 |
10.2 Poland Metals Service Centers Market Competitive Benchmarking, By Operating and Technical Parameters |
11 Company Profiles |
12 Recommendations |
13 Disclaimer |
Global Go To Market Strategy - 2030
Export potential enables firms to identify high-growth global markets with greater confidence by combining advanced trade intelligence with a structured quantitative methodology. The framework analyzes emerging demand trends and country-level import patterns while integrating macroeconomic and trade datasets such as GDP and population forecasts, bilateral import–export flows, tariff structures, elasticity differentials between developed and developing economies, geographic distance, and import demand projections. Using weighted trade values from 2020–2024 as the base period to project country-to-country export potential for 2030, these inputs are operationalized through calculated drivers such as gravity model parameters, tariff impact factors, and projected GDP per-capita growth. Through an analysis of hidden potentials, demand hotspots, and market conditions that are most favorable to success, this method enables firms to focus on target countries, maximize returns, and global expansion with data, backed by accuracy.
By factoring in the projected importer demand gap that is currently unmet and could be potential opportunity, it identifies the potential for the Exporter (Country) among 190 countries, against the general trade analysis, which identifies the biggest importer or exporter.
To discover high-growth global markets and optimize your business strategy:
Click Here
Pricing
- Single User License$ 1,995
- Department License$ 2,400
- Site License$ 3,120
- Global License$ 3,795

Leadership Perspectives from Industry Events
Search
Thought Leadership and Analyst Meet


Our Clients
6WResearch In News
- India Air Conditioner Market Set for Strong Rebound in 2026 After Weather-Led Correction and GST-Driven Recovery: 6Wresearch
- ADAS in India: How Automatic Emergency Braking, Blind Spot Detection & Driver Monitoring are Transforming Road Safety
- Doha a strategic location for EV manufacturing hub: IPA Qatar
- Demand for luxury TVs surging in the GCC, says Samsung
- Empowering Growth: The Thriving Journey of Bangladesh’s Cable Industry
- Demand for luxury TVs surging in the GCC, says Samsung
Latest Reports
- Poland Fire Protection Systems Market (2026-2032)
- Cape Verde Portable Hand-Thrown Extinguisher Market (2026-2032)
- Canada Portable Hand-Thrown Extinguisher Market (2026-2032)
- Cameroon Portable Hand-Thrown Extinguisher Market (2026-2032)
- Burundi Portable Hand-Thrown Extinguisher Market (2026-2032)
- Burkina Faso Portable Hand-Thrown Extinguisher Market (2026-2032)
- Bulgaria Portable Hand-Thrown Extinguisher Market (2026-2032)
- Brunei Portable Hand-Thrown Extinguisher Market (2026-2032)
- Botswana Portable Hand-Thrown Extinguisher Market (2026-2032)
- Bosnia and Herzegovina Portable Hand-Thrown Extinguisher Market (2026-2032)
Industry Events and Analyst Meet

HIMTEX 2026

India Refining Summit 2026

India EV Show 2026

EV tech India Expo 2026

Auto Tech Asia 2026
Whitepaper
- Middle East & Africa Commercial Security Market Click here to view more.
- Middle East & Africa Fire Safety Systems & Equipment Market Click here to view more.
- GCC Drone Market Click here to view more.
- Middle East Lighting Fixture Market Click here to view more.
- GCC Physical & Perimeter Security Market Click here to view more.