Saudi Arabia Switchgear Market (2016-2022) | Analysis, Trends, Revenue, Value, Growth, Outlook, Size, Industry, Companies, Share & Forecast
Market Forecast by Types (Air Insulated, Gas Insulated, Hybrid and Others), Voltage (Low (<1 KV), Medium (3 KV-36 KV) and High (>36 KV)), Verticals (Residential, Commercial, Industrial, Power Utilities and Infrastructure & Transportation) and Regions (Central, Eastern, Western and Southern) and Competitive Landscape
| Product Code: ETC000318 | Publication Date: Aug 2016 | Updated Date: Aug 2025 | Product Type: Report | |
| Publisher: 6Wresearch | Author: Ravi Bhandari | No. of Pages: 145 | No. of Figures: 75 | No. of Tables: 30 |
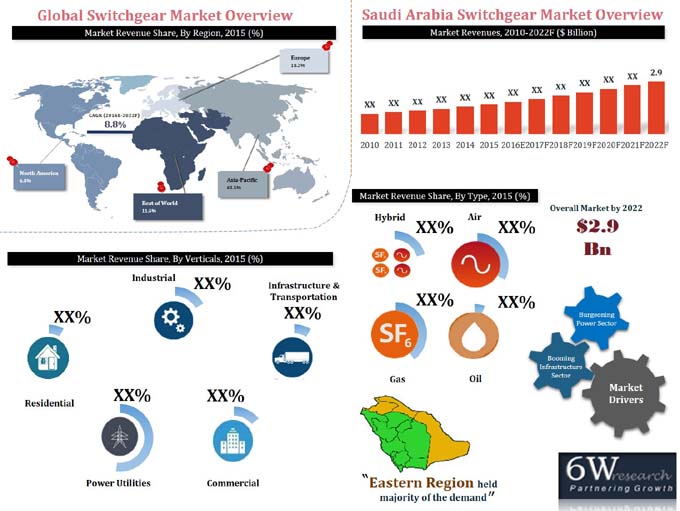
Rapid urbanization owing to the rising population, growing industrialization, increasing infrastructure development activities, and large scale investments in the power transmission & distribution sectors are the prime factors that have led to the growth of the switchgear market in Saudi Arabia. Currently, the Saudi Arabia Switchgear market is dominated by gas-insulated switchgear on account of technological and economic advantages associated with it over air-insulated switchgear. High voltage switchgear has acquired the highest revenue share owing to the increasing need for these in the power utility segments.
According to 6Wresearch, Saudi Arabia switchgear market is projected to reach $2.9 billion by 2022. The grid strengthening and interconnection of regions that involve the establishment of more than 25 substations are likely to fuel the demand for switchgear. The power utility segment accounted for the majority of the revenue share in Saudi Arabia's switchgear market. Over the next six years, the commercial and industrial segments are forecast to exhibit strong growth in the market.
Amongst all regions, eastern, central, and western regions captured the largest revenue shares in the country. During 2016-22, central and western regions are expected to register a larger number of switchgear installations.
The report thoroughly covers the market by switchgear types, by voltage, by verticals, and by regions. The report provides unbiased and detailed analysis of the on-going trends, opportunities/ high growth areas, market drivers, which would help stakeholders to device and align market strategies according to the current and future market dynamics.
Key Highlights of the Report:
• Market Size & Revenue Forecast of Global Switchgear Market until 2022
• Historical Market Revenue Trends for Saudi Arabia Switchgear Market, 2010 - 2015
• Market Size & Revenue Forecast of Saudi Arabia Switchgear Market until 2022
• Historical Market Volume Trends for Saudi Arabia Switchgear Market, 2010 - 2015
• Market Size & Volume Forecast of Saudi Arabia Switchgear Market until 2022
• Market Volume and Revenue Forecast and Estimations by Voltage until 2022
• Market Volume and Revenue Forecast and Estimations by Verticals until 2022
• Market Revenue Trends and Forecast by Region until 2022
• Market Dynamics Including Drivers, Restraints, Opportunity for Saudi Arabia Switchgear Market
• Existing Market Trends
• Industry Life Cycle
• Porter's Five Forces Analysis
• Players Market Share
• Competitive Benchmarking
• Company Profiles
• Key Strategic Pointers
Markets Covered
The report provides a detailed analysis of the following market segments:
• By Switchgear Types:
o Air Insulated Switchgear
o Gas Insulated Switchgear
o Hybrid Switchgear
o Other Switchgear
• By Voltage Types:
o Low (< 1 KV)
o Medium (3 KV - 36 KV)
o High (> 36 KV)
• By Verticals:
o Residential
o Commercial
o Industrial
o Power Utilities
o Infrastructure & Transportation
• By Regions:
o Central
o Eastern
o Western
o Southern
6Wresearch tracks and manages databases of global switchgear market. 6wresearch have been supporting various stakeholders in desigining their entry and growth strategies with the help of robust research and forecasting tools. We have been identifying and tracking various KPIs across major geographies enabling growth projections. With in-house research and data analytics capabilties, 6wresearch delivers actionable insights for companies to make Go/No-Go decisions.
Frequently Asked Questions About the Market Study (FAQs):
6Wresearch actively monitors the Saudi Arabia Switchgear Market and publishes its comprehensive annual report, highlighting emerging trends, growth drivers, revenue analysis, and forecast outlook. Our insights help businesses to make data-backed strategic decisions with ongoing market dynamics. Our analysts track relevent industries related to the Saudi Arabia Switchgear Market, allowing our clients with actionable intelligence and reliable forecasts tailored to emerging regional needs.
Yes, we provide customisation as per your requirements. To learn more, feel free to contact us on sales@6wresearch.com
TABLE OF CONTENTS
1 Executive Summary
2 Introduction
2.1 Key Highlights of the Report
2.2 Report Description
2.3 Market Scope & Segmentation
2.4 Research Methodology
2.5 Assumptions
3 Global Switchgear Market Overview
3.1 Global Switchgear Market Revenues (2010-2022F)
3.2 Global Switchgear Market Revenue Share, By Region (2015 & 2022F)
4 Saudi Arabia Switchgear Market Overview
4.1 Saudi Arabia Switchgear Market Revenues (2010-2022F)
4.2 Saudi Arabia Switchgear Market Volume (2010-2022F)
4.3 Saudi Arabia Switchgear Market Revenue Share, By Type (2015 & 2022F)
4.4 Saudi Arabia Switchgear Market Revenue Share, By Voltage (2015 & 2022F)
4.5 Saudi Arabia Switchgear Market Revenue Share, By Verticals (2015 & 2022F)
4.6 Saudi Arabia Switchgear Market Revenue Share, By Regions (2015 & 2022F)
4.7 Saudi Arabia Switchgear Market Industry Life Cycle
4.8 Saudi Arabia Switchgear Market Porter's Five Forces
4.9 Saudi Arabia Switchgear Market Opportunity Matrix
5 Saudi Arabia Switchgear Market Dynamics
5.1 Impact Analysis
5.2 Market Drivers
5.3 Market Restraints
6 Saudi Arabia Switchgear Market Trends
6.1 Increasing Penetration of Gas Insulated Switchgears
6.2 Rising Demand for Smart Grids
7 Saudi Arabia Air Switchgear Market Overview
7.1 Saudi Arabia Air Switchgear Market Revenues (2010-2022F)
7.1.1 Saudi Arabia Air Switchgear Market Revenues, By Voltage (2010-2022F)
7.2 Saudi Arabia Air Switchgear Market Volume (2010-2022F)
7.2.1 Saudi Arabia Air Switchgear Market Volume, By Voltage (2010-2022F)
7.3 Saudi Arabia Air Switchgear Market Revenues, By Verticals
7.4 Saudi Arabia Air Switchgear Market Price Trend (2010-2022F)
8 Saudi Arabia Gas Switchgear Market Overview
8.1 Saudi Arabia Gas Switchgear Market Revenues (2010-2022F)
8.1.1 Saudi Arabia Gas Switchgear Market Revenues, By Voltage (2010-2022F)
8.2 Saudi Arabia Gas Switchgear Market Volume (2010-2022F)
8.2.1 Saudi Arabia Gas Switchgear Market Volume, By Voltage (2010-2022F)
8.3 Saudi Arabia Gas Switchgear Market Revenues, By Verticals
8.4 Saudi Arabia Gas Switchgear Market Price Trend (2010-2022F)
9 Saudi Arabia Hybrid Switchgear Market Overview
9.1 Saudi Arabia Hybrid Switchgear Market Revenues (2010-2022F)
9.2 Saudi Arabia Hybrid Switchgear Market Volume (2010-2022F)
9.3 Saudi Arabia Hybrid Switchgear Market Revenues, By Verticals
9.4 Saudi Arabia Hybrid Switchgear Market Price Trend (2010-2022F)
10 Other Saudi Arabia Switchgear Market Overview
10.1 Other Saudi Arabia Hybrid Switchgear Market Revenues (2010-2022F)
10.1.1 Other Saudi Arabia Hybrid Switchgear Market Revenues, By Voltage (2010-2022F)
10.2 Other Saudi Arabia Hybrid Switchgear Market Volume (2010-2022F)
10.2.1 Other Saudi Arabia Hybrid Switchgear Market Volume, By Voltage (2010-2022F)
10.3 Other Saudi Arabia Hybrid Switchgear Market Revenues, By Verticals
10.4 Other Saudi Arabia Hybrid Switchgear Market Price Trend (2010-2022F)
11 Saudi Arabia Low Voltage Switchgear Market Overview
11.1 Saudi Arabia Low Voltage Switchgear Market Revenues (2010-2022F)
11.2 Saudi Arabia Low Voltage Switchgear Market Volume (2010-2022F)
11.3 Saudi Arabia Low Voltage Switchgear Market Price Trend (2010-2022F)
12 Saudi Arabia Medium Voltage Switchgear Market Overview
12.1 Saudi Arabia Medium Voltage Switchgear Market Revenue (2010-2022F)
12.2 Saudi Arabia Medium Voltage Switchgear Market Volume (2010-2022F)
12.3 Saudi Arabia Medium Voltage Switchgear Market Price Trend (2010-2022F)
13 Saudi Arabia High Voltage Switchgear Market Overview
13.1 Saudi Arabia High Voltage Switchgear Market Revenue (2010-2022F)
13.2 Saudi Arabia High Voltage Switchgear Market Volume (2010-2022F)
13.3 Saudi Arabia High Voltage Switchgear Market Price Trend (2010-2022F)
14 Saudi Arabia Switchgear Market Overview, By Verticals
14.1 Saudi Arabia Residential Switchgear Market Revenues (2010-2022F)
14.2 Saudi Arabia Industrial Switchgear Market Revenues (2010-2022F)
14.3 Saudi Arabia Infrastructure & Transportation Switchgear Market Revenues (2010-2022F)
14.4 Saudi Arabia Commercial Switchgear Market Revenues (2010-2022F)
14.5 Saudi Arabia Power Utilities Switchgear Market Revenues (2010-2022F)
15 Saudi Arabia Switchgear Market Overview, By Regions
15.1 Saudi Arabia Central Region Market Revenues (2010 & 2022F)
15.2 Saudi Arabia Western Region Market Revenues (2010 & 2022F)
15.3 Saudi Arabia Eastern Region Market Revenues (2010 & 2022F)
15.4 Saudi Arabia Southern Region Market Revenues (2010 & 2022F)
16 Competitive Landscape
16.1 Saudi Arabia Switchgear Market Revenue, By Company
16.2 Competitive Benchmarking, By Technology
17 Company Profile
17.1 AL Fanar Company Ltd.
17.2 ABB Ltd.
17.4 General Electric Company
17.5 Hitachi Ltd.
17.6 Hyundai Heavy Industries Co., LTD.
17.7 Hyosung Corporation
17.8 Larsen & Toubro
17.9 Schneider Electric SE
17.10 Siemens AG
18 Key Strategic Pointers
19 Disclaimer
List of Figures
Figure 1 Global Switchgear Market Revenues, 2015-2022F ($ Million)
Figure 2 Global Switchgear Market Revenue Share, By Region, (2015) (Million Units)
Figure 3 Saudi Arabia Switchgear Market Revenues, 2010-2022F ($ Million)
Figure 4 Saudi Arabia Anticipated electrical Loads, By Region (MW)
Figure 5 Upcoming Economic Cities in Saudi Arabia with Expected Investments
Figure 6 Saudi Arabia Switchgear Market Volume, 2010-2022F ($ Million)
Figure 7 Saudi Arabia Switchgear Market Revenue Share, By Type(2015)
Figure 8 Saudi Arabia Switchgear Market Revenue Share, By Type (2022F)
Figure 9 Saudi Arabia Switchgear Market Revenue Share, By Voltage (2015)
Figure 10 Saudi Arabia Switchgear Market Revenue Share, By Voltage (2022F)
Figure 11 Saudi Arabia Switchgear Market Revenue Share, By Verticals (2015)
Figure 12 Saudi Arabia Switchgear Market Revenue Share, By Verticals (2022F)
Figure 13 Saudi Arabia Switchgear Market Revenue Share, By Region (2015 & 2022F)
Figure 14 Saudi Arabia Electricity Consumption, By Verticals (2014)
Figure 15 Saudi Arabia Electricity Generation Equipment, 2010-2014 (Units)
Figure 16 Actual and Projected Peak Load, 2010-2020F (in GW)
Figure 17 Saudi Arabia Electricity Consumption, By KWh/Capita, 2010-2014
Figure 18 Saudi Arabia Electricity Consumer Trend, 2010-2014 (In Millions)
Figure 19 Saudi Arabia Allocation of New and Existing Projects (2015)
Figure 20 Saudi Arabia Construction Contractor Awards, 2013-2015 ($ Million)
Figure 21 Saudi Arabia Air Insulated Switchgear Market Revenues, 2010-22F ($ Million)
Figure 22 Saudi Arabia Air Insulated Switchgear Market Volume, 2010-22F (Thousand Units)
Figure 23 Saudi Arabia Air Insulated Switchgear Market Price Trend, 2010-22F
Figure 24 Saudi Arabia Gas Insulated Switchgear Market Revenues, 2010-22F ($ Million)
Figure 25 Saudi Arabia Gas Insulated Switchgear Market Volume, 2010-22F ($ Million)
Figure 26 Saudi Arabia Gas Insulated Switchgear Market Price Trend, 2010-22F
Figure 27 Saudi Arabia Hybrid Switchgear Market Revenues, 2010-22F ($ Million)
Figure 28 Saudi Arabia Hybrid Switchgear Market Volume 2010-22F ($ Million)
Figure 29 Saudi Arabia Hybrid Switchgear Market Price Trend, 2010-22F
Figure 30 Saudi Arabia Other Switchgear Market Revenues, 2010-22F ($ Million)
Figure 31 Saudi Arabia Other Switchgear Market Volume, 2010-22F ($ Million)
Figure 32 Saud Arabia Other Switchgear Market Price Trend, 2010-22F
Figure 33 Saudi Arabia Low Voltage Switchgear Market Revenues, 2010-22F ($ Million)
Figure 34 Saudi Arabia Low Voltage Switchgear Market Volume, 2010-22F ($ Million)
Figure 35 Saud Arabia Low Voltage Switchgear Market Price Trend, 2010-22F
Figure 36 Saudi Arabia Medium Voltage Switchgear Market Revenues, 2010-22F ($ Million)
Figure 37 Saudi Arabia Medium Voltage Switchgear Market Volume, 2010-22F ($ Million)
Figure 38 Saud Arabia Medium Voltage Switchgear Market Price Trend, 2010-22F
Figure 39 Saudi Arabia High Voltage Switchgear Market Revenues, 2010-22F ($ Million)
Figure 40 Saudi Arabia High Voltage Switchgear Market Volume, 2010-22F ($ Million)
Figure 41 Saud Arabia High Voltage Switchgear Market Price Trend, 2010-22F
Figure 42 Saudi Arabia Residential Switchgear Market Revenues, 2010-22F ($ Million)
Figure 43 Riyadh No. of Residential Units, 2012-17F (Thousand Units)
Figure 44 Jeddah No. of Residential Units, 2012-17F (Thousand Units)
Figure 45 Upcoming Residential Projects in Saudi Arabia
Figure 46 Saudi Arabia Industrial Switchgear Market Revenues, 2010-22F ($ Million)
Figure 47 Saudi Arabia Upcoming Industrial Projects
Figure 48 Saudi Arabia Industrial Units, 2010-2015 (Units)
Figure 49 Saudi Arabia Infrastructure & Transportation Switchgear Market Revenues, 2010-22F ($ Million)
Figure 50 Upcoming Transportation Projects in Saudi Arabia
Figure 51 Upcoming Construction Projects in Saudi Arabia
Figure 52 Saudi Arabia Commercial Switchgear Market Revenues, 2010-22F ($ Million)
Figure 53 Riyadh Office Supply, 2012-2017F (Sq. m, Thousand Units)
Figure 54 Jeddah Office Supply, 2012-2017F (Sq. m, Thousand Units)
Figure 55 Riyadh Retail Supply, 2012-2017F (Sq. m, Thousand Units)
Figure 56 Jeddah Retail Supply, 2012-2017F (Sq. m, Thousand Units)
Figure 57 Riyadh Hotel Supply, 2012-2017F (Sq. m, Thousand Units)
Figure 58 Riyadh Hotel Supply, 2012-2017F (Sq. m, Thousand Units)
Figure 59 Major Upcoming Healthcare Projects
Figure 60 Saudi Arabia Power Utilities Switchgear Market Revenues, 2010-22F ($ Million)
Figure 61 Transmission and Distribution Lines (In-Circuit Km.)
Figure 62 Saudi Arabia Installed and Available Capacity (In GW)
Figure 63 Saudi Arabia Number of Substations, 2010-2014 (Units)
Figure 64 Saudi Arabia Number of Transmission and Distribution Transformers, 2010-2014 (Units)
Figure 65 Saudi Arabia Central Region Switchgear Market Revenues, 2010-15 ($ Million)
Figure 66 Saudi Arabia Central Region Switchgear Market Revenues, 2016E-22F ($ Million)
Figure 67 Saudi Arabia Western Region Switchgear Market Revenues, 2010-15 ($ Million)
Figure 68 Saudi Arabia Western Region Switchgear Market Revenues, 2016E-22F ($ Million)
Figure 69 Saudi Arabia Eastern Region Switchgear Market Revenues, 2010-15 ($ Million)
Figure 70 Saudi Arabia Eastern Region Switchgear Market Revenues, 2016E-22F ($ Million)
Figure 71 Saudi Arabia Southern Region Switchgear Market Revenues, 2010-15 ($ Million)
Figure 72 Saudi Arabia Southern Region Switchgear Market Revenues, 2016E-22F ($ Million)
Figure 73 Saudi Arabia Transmission and Distribution Networks, By Region
Figure 74 Saudi Arabia Electricity Consumers, By Region
Figure 75 Saudi Arabia Switchgear Market Revenue Share, By Companies (2015)
List of Tables
Table 1 Saudi Arabia Ninth and Tenth Development Plan (2010-2020)
Table 2 Saudi Arabia Major Infrastructure Projects ($ Million)
Table 3 Saudi Arabia Air Insulated Switchgear Market Revenue Share, By Voltage, 2010-2015 ($ Million)
Table 4 Saudi Arabia Air Insulated Switchgear Market Revenue Share, By Voltage, 2016E-2022F ($ Million)
Table 5 Saudi Arabia Air Insulated Switchgear Market Volume Share, By Voltage, 2010-2015 (Thousand Units)
Table 6 Saudi Arabia Air Insulated Switchgear Market Volume Share, By Voltage, 2016E-2022F (Thousand Units)
Table 7 Saudi Arabia Air Insulated Switchgear Market Revenue Share, By Verticals, 2010-2015 ($ Million)
Table 8 Saudi Arabia Air Insulated Switchgear Market Revenue Share, By Verticals, 2016E-2022F ($ Million)
Table 9 Saudi Arabia Gas Insulated Switchgear Market Revenue Share, By Voltage, 2010-2015 ($ Million)
Table 10 Saudi Arabia Gas Insulated Switchgear Market Revenue Share, By Voltage, 2016E-2022F ($ Million)
Table 11 Saudi Arabia Gas Insulated Switchgear Market Volume Share, By Voltage, 2010-2015 (Thousand Units)
Table 12 Saudi Arabia Gas Insulated Switchgear Market Volume Share, By Voltage, 2016E-2022F (Thousand Units)
Table 13 Saudi Arabia Gas Insulated Switchgear Market Revenue Share, By Verticals, 2010-2015 ($ Million)
Table 14 Saudi Arabia Gas Insulated Switchgear Market Revenue Share, By Verticals, 2016E-2022F ($ Million)
Table 15 Saudi Arabia Hybrid Switchgear Market Revenue Share, By Verticals, 2010-2015 ($ Million)
Table 16 Saudi Arabia Hybrid Switchgear Market Revenue Share, By Verticals, 2016E-2022F ($ Million)
Table 17 Saudi Arabia Other Switchgear Market Revenue Share, By Voltage, 2010-2015 ($ Million)
Table 18 Saudi Arabia Other Switchgear Market Revenue Share, By Voltage, 2016E-2022F ($ Million)
Table 19 Saudi Arabia Other Switchgear Market Volume Share, By Voltage, 2010-2015 (Thousand Units)
Table 20 Saudi Arabia Other Switchgear Market Volume Share, By Voltage, 2016E-2022F (Thousand Units)
Table 21 Saudi Arabia Other Switchgear Market Revenue Share, By Verticals, 2010-2015 ($ Million)
Table 22 Saudi Arabia Other Switchgear Market Revenue Share, By Verticals, 2016E-2022F ($ Million)
Table 23 Saudi Arabia Upcoming Generation Projects
Table 24 Saudi Arabia Planned Transmission Interconnection Projects (380 KV)
Table 25 Saudi Arabia Switchgear Market Revenue Share of Top 3 Players, 2015 ($ Million)
Pricing
- Single User License$ 1,995
- Department License$ 2,400
- Site License$ 3,120
- Global License$ 3,795

Search
Thought Leadership and Analyst Meet


Our Clients
Related Reports
- Afghanistan Apparel Market (2026-2032) | Growth, Outlook, Industry, Segmentation, Forecast, Size, Companies, Trends, Value, Share, Analysis & Revenue
- Canada Oil and Gas Market (2026-2032) | Share, Segmentation, Value, Industry, Trends, Forecast, Analysis, Size & Revenue, Growth, Competitive Landscape, Outlook, Companies
- Germany Breakfast Food Market (2026-2032) | Industry, Share, Growth, Size, Companies, Value, Analysis, Revenue, Trends, Forecast & Outlook
- Australia Briquette Market (2025-2031) | Growth, Size, Revenue, Forecast, Analysis, Trends, Value, Share, Industry & Companies
- Vietnam System Integrator Market (2025-2031) | Size, Companies, Analysis, Industry, Value, Forecast, Growth, Trends, Revenue & Share
- ASEAN and Thailand Brain Health Supplements Market (2025-2031) | Strategy, Consumer Insights, Analysis, Investment Trends, Opportunities, Growth, Size, Share, Industry, Revenue, Segments, Value, Segmentation, Supply, Forecast, Restraints, Outlook, Competition, Drivers, Trends, Demand, Pricing Analysis, Competitive, Strategic Insights, Companies, Challenges
- ASEAN Bearings Market (2025-2031) | Strategy, Consumer Insights, Analysis, Investment Trends, Opportunities, Growth, Size, Share, Industry, Revenue, Segments, Value, Segmentation, Supply, Forecast, Restraints, Outlook, Competition, Drivers, Trends, Demand, Pricing Analysis, Competitive, Strategic Insights, Companies, Challenges
- Europe Flooring Market (2025-2031) | Outlook, Share, Industry, Trends, Forecast, Companies, Revenue, Size, Analysis, Growth & Value
- Saudi Arabia Manlift Market (2025-2031) | Outlook, Size, Growth, Trends, Companies, Industry, Revenue, Value, Share, Forecast & Analysis
- Uganda Excavator, Crane, and Wheel Loaders Market (2025-2031) | Strategy, Consumer Insights, Analysis, Investment Trends, Opportunities, Growth, Size, Share, Industry, Revenue, Segments, Value, Segmentation, Supply, Forecast, Restraints, Outlook, Competition, Drivers, Trends, Demand, Pricing Analysis, Competitive, Strategic Insights, Companies, Challenges
Industry Events and Analyst Meet

Stationery & Paper Expo Saudi Arabia 2026

Kids & Toys Expo Saudi Arabia 2026

Gifts & Homeware Expo Saudi Arabia 2026

Smart Home Expo 2026

Industrial Facilities Management Expo 2025
Whitepaper
- Middle East & Africa Commercial Security Market Click here to view more.
- Middle East & Africa Fire Safety Systems & Equipment Market Click here to view more.
- GCC Drone Market Click here to view more.
- Middle East Lighting Fixture Market Click here to view more.
- GCC Physical & Perimeter Security Market Click here to view more.
6WResearch In News
- Doha a strategic location for EV manufacturing hub: IPA Qatar
- Demand for luxury TVs surging in the GCC, says Samsung
- Empowering Growth: The Thriving Journey of Bangladesh’s Cable Industry
- Demand for luxury TVs surging in the GCC, says Samsung
- Video call with a traditional healer? Once unthinkable, it’s now common in South Africa
- Intelligent Buildings To Smooth GCC’s Path To Net Zero