Saudi Arabia Ready To Drink Tea And Coffee Market (2026-2032) | Size & Revenue, Trends, Forecast, Industry, Analysis, Value, Competitive Landscape, Companies, Segmentation, Growth, Share, Outlook
Market Forecast By Product (RTD Tea, Black, Green, Fruit, RTD Coffee, Cold brew coffee, Iced coffee, Others), By Packaging (Canned, Glass Bottle, PET Bottle, Others), By Price (Premium, Economy) And Competitive Landscape
| Product Code: ETC9174694 | Publication Date: Sep 2024 | Updated Date: Feb 2026 | Product Type: Market Research Report | |
| Publisher: 6Wresearch | Author: Summon Dutta | No. of Pages: 75 | No. of Figures: 35 | No. of Tables: 20 |
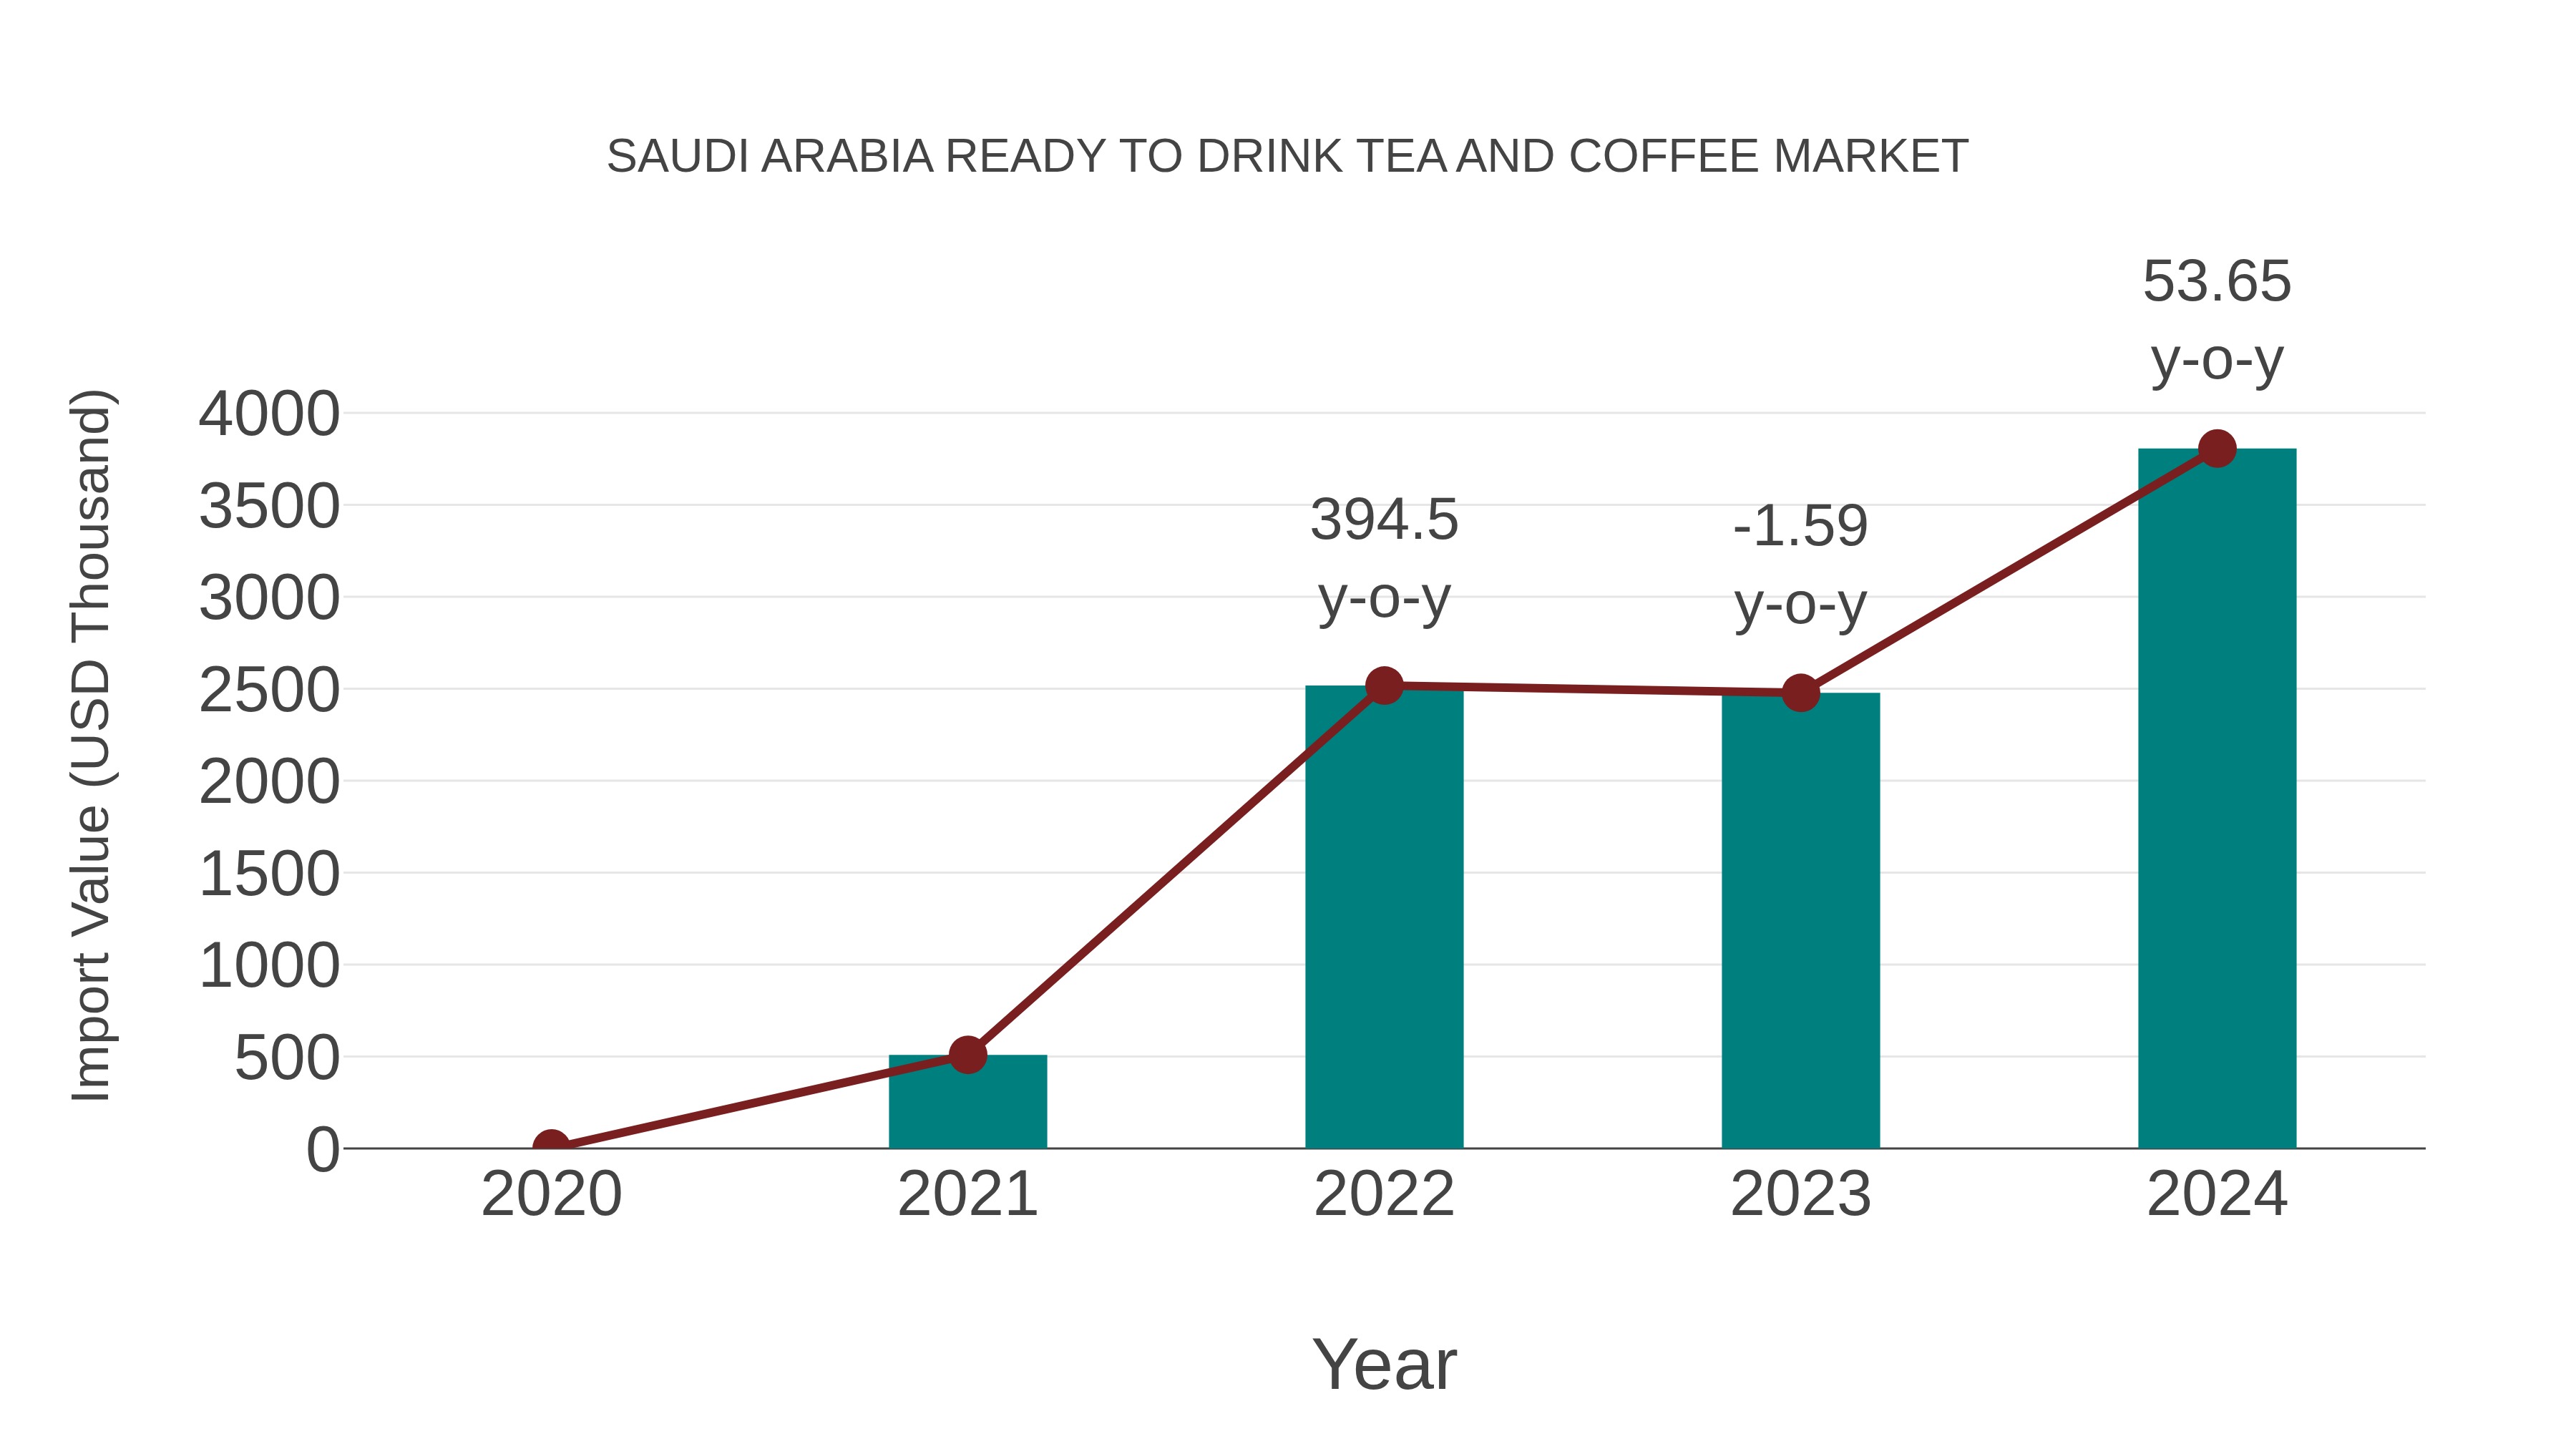
Saudi Arabia Ready to Drink Tea and Coffee Market: Import Trend Analysis
In 2024, Saudi Arabia experienced a notable increase in imports of ready-to-drink tea and coffee products. The market saw a steady growth trend, reflecting consumer preferences for convenience and on-the-go beverages. This rise in imports indicates a shifting consumption pattern in the beverage sector.
Key Highlights of the Report:
- Saudi Arabia Ready To Drink Tea And Coffee Market Outlook
- Market Size of Saudi Arabia Ready To Drink Tea And Coffee Market, 2025
- Forecast of Saudi Arabia Ready To Drink Tea And Coffee Market, 2032
- Historical Data and Forecast of Saudi Arabia Ready To Drink Tea And Coffee Revenues & Volume for the Period 2022-2032F
- Saudi Arabia Ready To Drink Tea And Coffee Market Trend Evolution
- Saudi Arabia Ready To Drink Tea And Coffee Market Drivers and Challenges
- Saudi Arabia Ready To Drink Tea And Coffee Price Trends
- Saudi Arabia Ready To Drink Tea And Coffee Porter's Five Forces
- Saudi Arabia Ready To Drink Tea And Coffee Industry Life Cycle
- Historical Data and Forecast of Saudi Arabia Ready To Drink Tea And Coffee Market Revenues & Volume By Product for the Period 2022-2032F
- Historical Data and Forecast of Saudi Arabia Ready To Drink Tea And Coffee Market Revenues & Volume By RTD Tea for the Period 2022-2032F
- Historical Data and Forecast of Saudi Arabia Ready To Drink Tea And Coffee Market Revenues & Volume By Black for the Period 2022-2032F
- Historical Data and Forecast of Saudi Arabia Ready To Drink Tea And Coffee Market Revenues & Volume By Green for the Period 2022-2032F
- Historical Data and Forecast of Saudi Arabia Ready To Drink Tea And Coffee Market Revenues & Volume By Fruit for the Period 2022-2032F
- Historical Data and Forecast of Saudi Arabia Ready To Drink Tea And Coffee Market Revenues & Volume By RTD Coffee for the Period 2022-2032F
- Historical Data and Forecast of Saudi Arabia Ready To Drink Tea And Coffee Market Revenues & Volume By Cold brew coffee for the Period 2022-2032F
- Historical Data and Forecast of Saudi Arabia Ready To Drink Tea And Coffee Market Revenues & Volume By Iced coffee for the Period 2022-2032F
- Historical Data and Forecast of Saudi Arabia RTD Tea Ready To Drink Tea And Coffee Market Revenues & Volume By Others for the Period 2022-2032F
- Historical Data and Forecast of Saudi Arabia Ready To Drink Tea And Coffee Market Revenues & Volume By Packaging for the Period 2022-2032F
- Historical Data and Forecast of Saudi Arabia Ready To Drink Tea And Coffee Market Revenues & Volume By Canned for the Period 2022-2032F
- Historical Data and Forecast of Saudi Arabia Ready To Drink Tea And Coffee Market Revenues & Volume By Glass Bottle for the Period 2022-2032F
- Historical Data and Forecast of Saudi Arabia Ready To Drink Tea And Coffee Market Revenues & Volume By PET Bottle for the Period 2022-2032F
- Historical Data and Forecast of Saudi Arabia Ready To Drink Tea And Coffee Market Revenues & Volume By Others for the Period 2022-2032F
- Historical Data and Forecast of Saudi Arabia Ready To Drink Tea And Coffee Market Revenues & Volume By Price for the Period 2022-2032F
- Historical Data and Forecast of Saudi Arabia Ready To Drink Tea And Coffee Market Revenues & Volume By Premium for the Period 2022-2032F
- Historical Data and Forecast of Saudi Arabia Ready To Drink Tea And Coffee Market Revenues & Volume By Economy for the Period 2022-2032F
- Saudi Arabia Ready To Drink Tea And Coffee Import Export Trade Statistics
- Market Opportunity Assessment By Product
- Market Opportunity Assessment By Packaging
- Market Opportunity Assessment By Price
- Saudi Arabia Ready To Drink Tea And Coffee Top Companies Market Share
- Saudi Arabia Ready To Drink Tea And Coffee Competitive Benchmarking By Technical and Operational Parameters
- Saudi Arabia Ready To Drink Tea And Coffee Company Profiles
- Saudi Arabia Ready To Drink Tea And Coffee Key Strategic Recommendations
Frequently Asked Questions About the Market Study (FAQs):
6Wresearch actively monitors the Saudi Arabia Ready To Drink Tea And Coffee Market and publishes its comprehensive annual report, highlighting emerging trends, growth drivers, revenue analysis, and forecast outlook. Our insights help businesses to make data-backed strategic decisions with ongoing market dynamics. Our analysts track relevent industries related to the Saudi Arabia Ready To Drink Tea And Coffee Market, allowing our clients with actionable intelligence and reliable forecasts tailored to emerging regional needs.
Yes, we provide customisation as per your requirements. To learn more, feel free to contact us on sales@6wresearch.com
1 Executive Summary |
2 Introduction |
2.1 Key Highlights of the Report |
2.2 Report Description |
2.3 Market Scope & Segmentation |
2.4 Research Methodology |
2.5 Assumptions |
3 Saudi Arabia Ready To Drink Tea And Coffee Market Overview |
3.1 Saudi Arabia Country Macro Economic Indicators |
3.2 Saudi Arabia Ready To Drink Tea And Coffee Market Revenues & Volume, 2022 & 2032F |
3.3 Saudi Arabia Ready To Drink Tea And Coffee Market - Industry Life Cycle |
3.4 Saudi Arabia Ready To Drink Tea And Coffee Market - Porter's Five Forces |
3.5 Saudi Arabia Ready To Drink Tea And Coffee Market Revenues & Volume Share, By Product, 2022 & 2032F |
3.6 Saudi Arabia Ready To Drink Tea And Coffee Market Revenues & Volume Share, By Packaging, 2022 & 2032F |
3.7 Saudi Arabia Ready To Drink Tea And Coffee Market Revenues & Volume Share, By Price, 2022 & 2032F |
4 Saudi Arabia Ready To Drink Tea And Coffee Market Dynamics |
4.1 Impact Analysis |
4.2 Market Drivers |
4.2.1 Increasing health consciousness among consumers leading to a preference for ready-to-drink tea and coffee as healthier alternatives to sugary beverages. |
4.2.2 Rising disposable incomes and urbanization driving a shift towards convenient beverage options. |
4.2.3 Growing trend of on-the-go consumption habits among the younger population. |
4.2.4 Expansion of distribution channels, such as supermarkets, convenience stores, and online platforms, increasing accessibility to ready-to-drink tea and coffee products. |
4.3 Market Restraints |
4.3.1 Fluctuating raw material prices impacting production costs. |
4.3.2 Intense competition from other beverage categories like energy drinks and soft drinks. |
4.3.3 Regulatory challenges related to labeling, ingredients, and health claims. |
4.3.4 Seasonal demand fluctuations affecting sales and production planning. |
5 Saudi Arabia Ready To Drink Tea And Coffee Market Trends |
6 Saudi Arabia Ready To Drink Tea And Coffee Market, By Types |
6.1 Saudi Arabia Ready To Drink Tea And Coffee Market, By Product |
6.1.1 Overview and Analysis |
6.1.2 Saudi Arabia Ready To Drink Tea And Coffee Market Revenues & Volume, By Product, 2022-2032F |
6.1.3 Saudi Arabia Ready To Drink Tea And Coffee Market Revenues & Volume, By RTD Tea, 2022-2032F |
6.1.4 Saudi Arabia Ready To Drink Tea And Coffee Market Revenues & Volume, By Black, 2022-2032F |
6.1.5 Saudi Arabia Ready To Drink Tea And Coffee Market Revenues & Volume, By Green, 2022-2032F |
6.1.6 Saudi Arabia Ready To Drink Tea And Coffee Market Revenues & Volume, By Fruit, 2022-2032F |
6.1.7 Saudi Arabia Ready To Drink Tea And Coffee Market Revenues & Volume, By RTD Coffee, 2022-2032F |
6.1.8 Saudi Arabia Ready To Drink Tea And Coffee Market Revenues & Volume, By Cold brew coffee, 2022-2032F |
6.1.9 Saudi Arabia Ready To Drink Tea And Coffee Market Revenues & Volume, By Others, 2022-2032F |
6.1.10 Saudi Arabia Ready To Drink Tea And Coffee Market Revenues & Volume, By Others, 2022-2032F |
6.2 Saudi Arabia Ready To Drink Tea And Coffee Market, By Packaging |
6.2.1 Overview and Analysis |
6.2.2 Saudi Arabia Ready To Drink Tea And Coffee Market Revenues & Volume, By Canned, 2022-2032F |
6.2.3 Saudi Arabia Ready To Drink Tea And Coffee Market Revenues & Volume, By Glass Bottle, 2022-2032F |
6.2.4 Saudi Arabia Ready To Drink Tea And Coffee Market Revenues & Volume, By PET Bottle, 2022-2032F |
6.2.5 Saudi Arabia Ready To Drink Tea And Coffee Market Revenues & Volume, By Others, 2022-2032F |
6.3 Saudi Arabia Ready To Drink Tea And Coffee Market, By Price |
6.3.1 Overview and Analysis |
6.3.2 Saudi Arabia Ready To Drink Tea And Coffee Market Revenues & Volume, By Premium, 2022-2032F |
6.3.3 Saudi Arabia Ready To Drink Tea And Coffee Market Revenues & Volume, By Economy, 2022-2032F |
7 Saudi Arabia Ready To Drink Tea And Coffee Market Import-Export Trade Statistics |
7.1 Saudi Arabia Ready To Drink Tea And Coffee Market Export to Major Countries |
7.2 Saudi Arabia Ready To Drink Tea And Coffee Market Imports from Major Countries |
8 Saudi Arabia Ready To Drink Tea And Coffee Market Key Performance Indicators |
8.1 Consumer engagement metrics on social media platforms (e.g., likes, shares, comments) to gauge brand awareness and market penetration. |
8.2 Percentage of repeat purchases and customer retention rates to measure product loyalty and satisfaction. |
8.3 Rate of new product launches and innovations in the market to assess competitiveness and adaptability to consumer preferences. |
8.4 Sustainability initiatives and certifications obtained by companies to evaluate environmental responsibility and appeal to eco-conscious consumers. |
8.5 Market research data on consumer preferences, trends, and demographics to make informed business decisions and product development strategies. |
9 Saudi Arabia Ready To Drink Tea And Coffee Market - Opportunity Assessment |
9.1 Saudi Arabia Ready To Drink Tea And Coffee Market Opportunity Assessment, By Product, 2022 & 2032F |
9.2 Saudi Arabia Ready To Drink Tea And Coffee Market Opportunity Assessment, By Packaging, 2022 & 2032F |
9.3 Saudi Arabia Ready To Drink Tea And Coffee Market Opportunity Assessment, By Price, 2022 & 2032F |
10 Saudi Arabia Ready To Drink Tea And Coffee Market - Competitive Landscape |
10.1 Saudi Arabia Ready To Drink Tea And Coffee Market Revenue Share, By Companies, 2025 |
10.2 Saudi Arabia Ready To Drink Tea And Coffee Market Competitive Benchmarking, By Operating and Technical Parameters |
11 Company Profiles |
12 Recommendations |
13 Disclaimer |
Global Go To Market Strategy - 2030
Export potential enables firms to identify high-growth global markets with greater confidence by combining advanced trade intelligence with a structured quantitative methodology. The framework analyzes emerging demand trends and country-level import patterns while integrating macroeconomic and trade datasets such as GDP and population forecasts, bilateral import–export flows, tariff structures, elasticity differentials between developed and developing economies, geographic distance, and import demand projections. Using weighted trade values from 2020–2024 as the base period to project country-to-country export potential for 2030, these inputs are operationalized through calculated drivers such as gravity model parameters, tariff impact factors, and projected GDP per-capita growth. Through an analysis of hidden potentials, demand hotspots, and market conditions that are most favorable to success, this method enables firms to focus on target countries, maximize returns, and global expansion with data, backed by accuracy.
By factoring in the projected importer demand gap that is currently unmet and could be potential opportunity, it identifies the potential for the Exporter (Country) among 190 countries, against the general trade analysis, which identifies the biggest importer or exporter.
To discover high-growth global markets and optimize your business strategy:
Click Here
Pricing
- Single User License$ 1,995
- Department License$ 2,400
- Site License$ 3,120
- Global License$ 3,795

Leadership Perspectives from Industry Events
Search
Thought Leadership and Analyst Meet


Our Clients
6WResearch In News
- India Air Conditioner Market Set for Strong Rebound in 2026 After Weather-Led Correction and GST-Driven Recovery: 6Wresearch
- ADAS in India: How Automatic Emergency Braking, Blind Spot Detection & Driver Monitoring are Transforming Road Safety
- Doha a strategic location for EV manufacturing hub: IPA Qatar
- Demand for luxury TVs surging in the GCC, says Samsung
- Empowering Growth: The Thriving Journey of Bangladesh’s Cable Industry
- Demand for luxury TVs surging in the GCC, says Samsung
Latest Reports
- Nicaragua RPG Gaming Market (2026-2032)
- New Zealand RPG Gaming Market (2026-2032)
- Netherlands RPG Gaming Market (2026-2032)
- Nauru RPG Gaming Market (2026-2032)
- Namibia RPG Gaming Market (2026-2032)
- Mozambique RPG Gaming Market (2026-2032)
- Montenegro RPG Gaming Market (2026-2032)
- Mongolia RPG Gaming Market (2026-2032)
- Monaco RPG Gaming Market (2026-2032)
- Micronesia RPG Gaming Market (2026-2032)
Industry Events and Analyst Meet

HIMTEX 2026

India Refining Summit 2026

India EV Show 2026

EV tech India Expo 2026

Auto Tech Asia 2026
Whitepaper
- Middle East & Africa Commercial Security Market Click here to view more.
- Middle East & Africa Fire Safety Systems & Equipment Market Click here to view more.
- GCC Drone Market Click here to view more.
- Middle East Lighting Fixture Market Click here to view more.
- GCC Physical & Perimeter Security Market Click here to view more.