Singapore Soft Drinks Packaging Market (2026-2032) Outlook | Value, Revenue, Industry, Analysis, Companies, Growth, Size, Trends, Forecast & Share
Market Forecast By Material (Paper, Plastic, Metal, Glass), By Product Type (Cans, Boxes, Bottles, Cartons), By Capacity (Up to 100 ml, 100 to 250 ml, 250 to 500 ml, 500 to 1000 ml, 1000 to 2000 ml, Above 2000 ml), By Application (Carbonated soft drinks, Functional Drinks, Sport Drinks, Energy Drinks, Others, Juices) And Competitive Landscape
| Product Code: ETC189879 | Publication Date: May 2022 | Updated Date: Jun 2026 | Product Type: Market Research Report | |
| Publisher: 6Wresearch | Author: Ravi Bhandari | No. of Pages: 60 | No. of Figures: 40 | No. of Tables: 7 |
Singapore Soft Drinks Packaging Market Size, Share & Growth Rate
The Singapore Soft Drinks Packaging Market was estimated at USD 472 Million in 2025 and is projected to reach USD 622 Million by 2032, growing at a CAGR of 4.0% from 2026 to 2032. This growth trajectory is primarily driven by increasing consumer demand for sustainable packaging solutions and health-oriented beverage options. As eco-consciousness rises, manufacturers are compelled to innovate packaging designs that align with these evolving preferences.
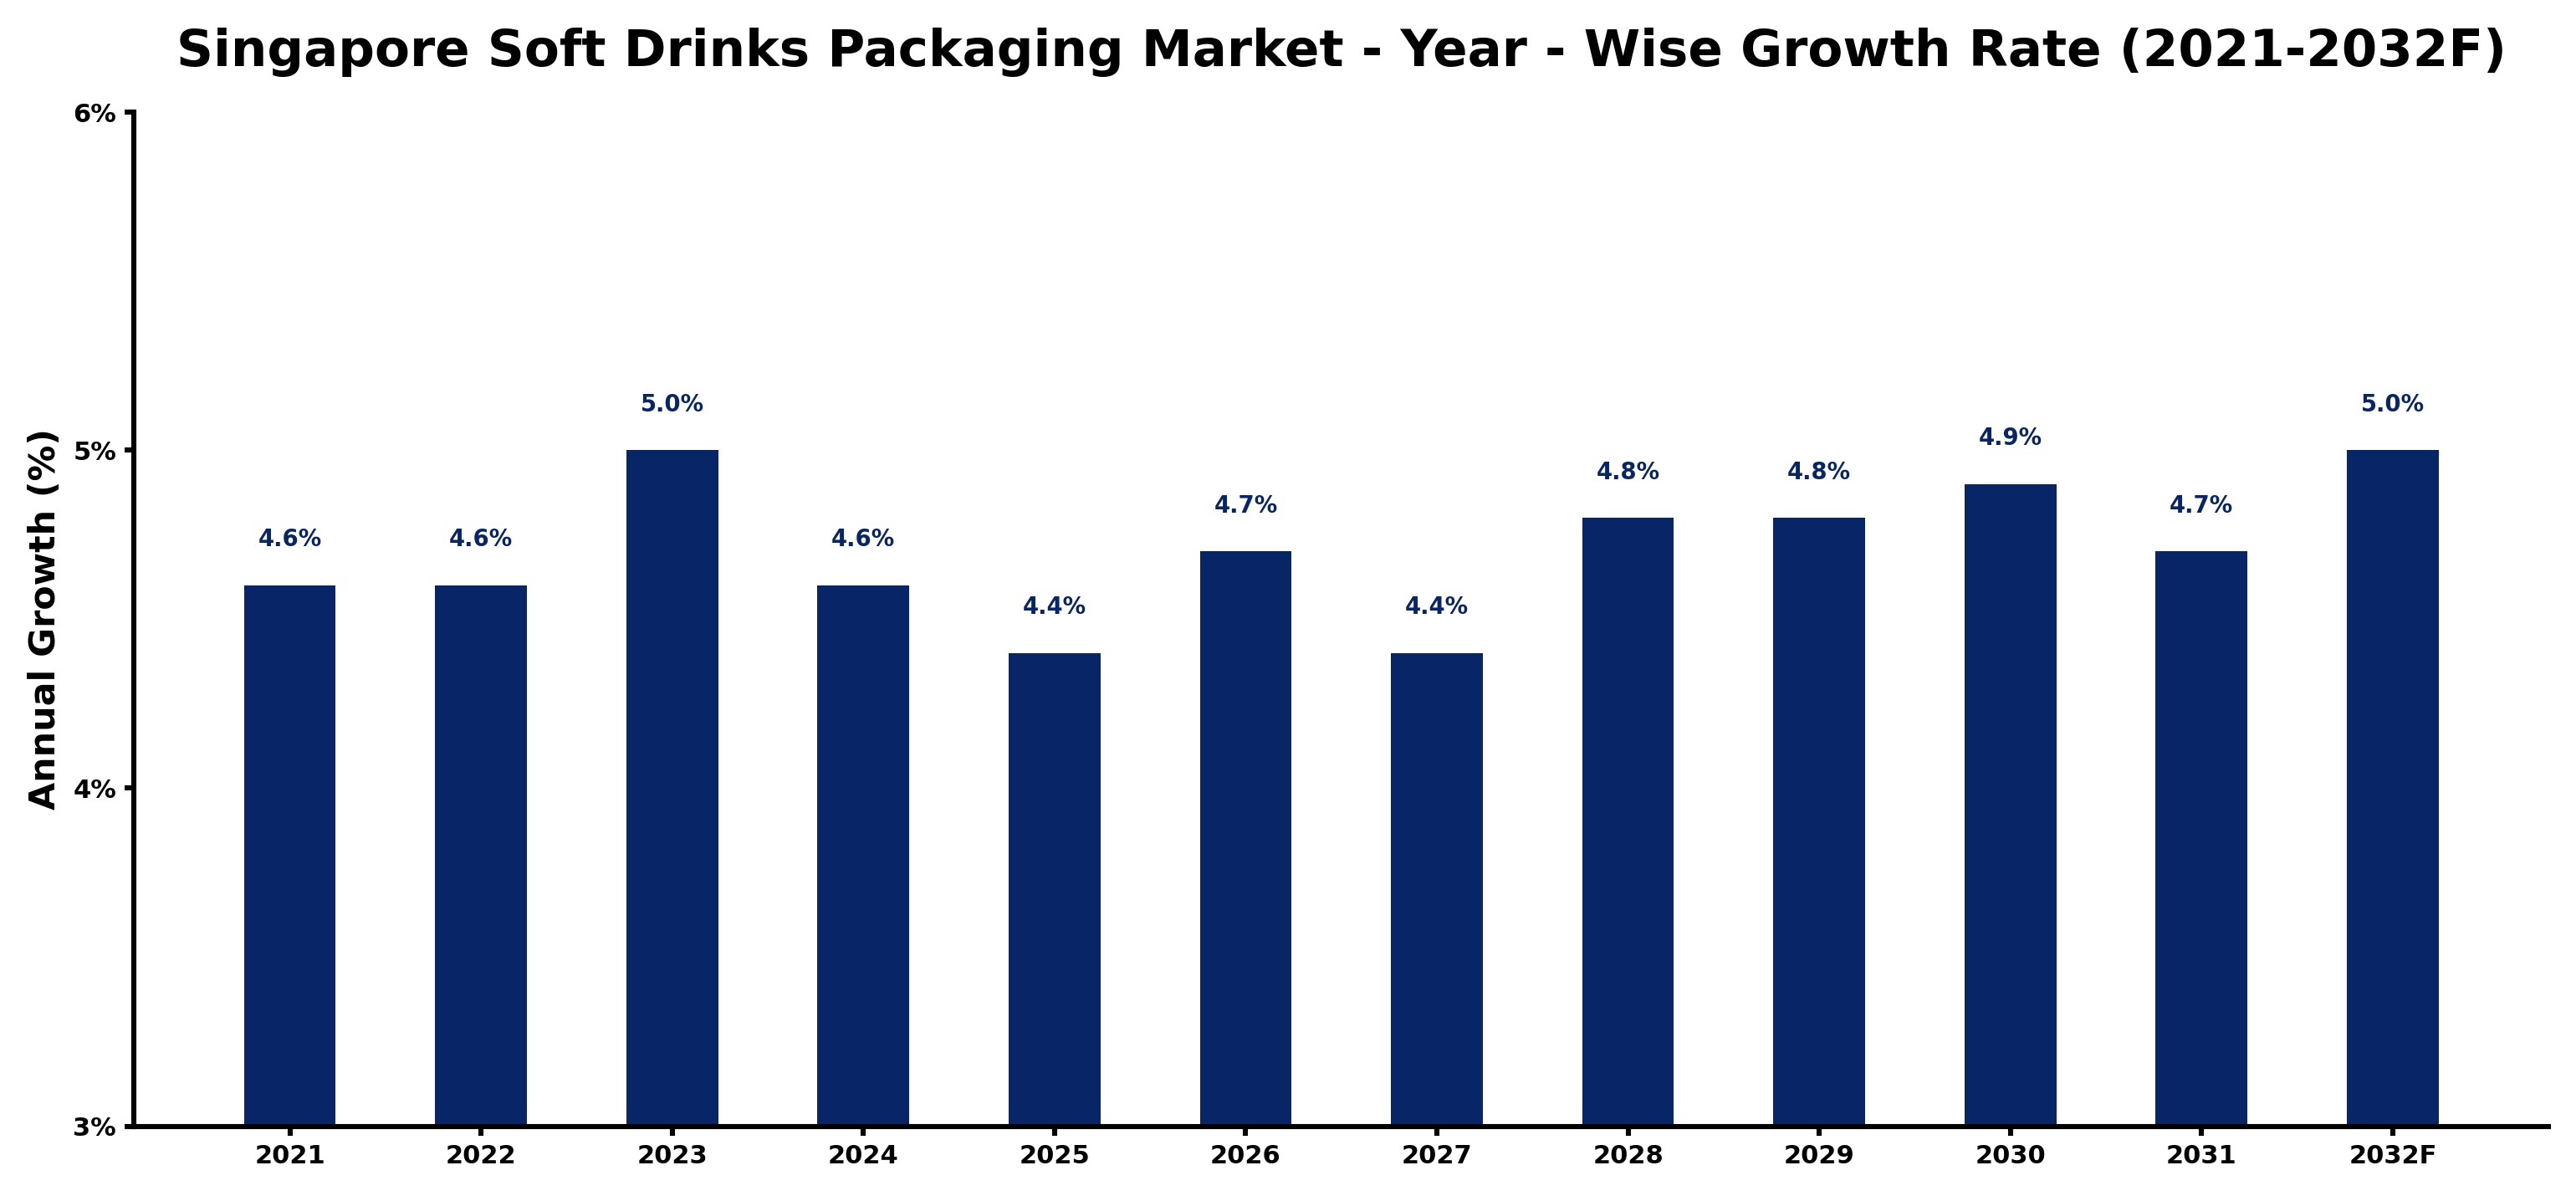
Singapore Soft Drinks Packaging Market Growth Rate Analysis (2021-2032)
The Singapore soft drinks packaging market is set for steady growth, with projections showing a rise of 4.6% in 2021, maintaining the same pace in 2022, followed by a slight increase to 5.0% in 2023. This growth is driven by robust consumer demand for innovative and sustainable packaging solutions, as environmentally-conscious choices become increasingly important. Factors such as advancements in packaging technology and infrastructure improvements contribute to the overall efficiency and appeal of soft drink products. The market stabilizes with growth rates fluctuating between 4.4% and 4.9% through 2032, reflecting a balanced interplay of consumer preferences and ongoing investments in the sector.
Singapore Soft Drinks Packaging Market Year-wise Growth Rate and Key Drivers
This graph highlights how the Singapore Soft Drinks Packaging Market has steadily grown over the past five years, supported by major growth factors.
The table below presents the year‑wise growth rates along with the key drivers influencing the market
| Year | Growth Rate | Major Drivers |
| 2021 | 4.6% | Sustainability trends influenced packaging |
| 2022 | 4.6% | Health consciousness drove innovation |
| 2023 | 5.0% | E-commerce growth expanded reach |
| 2024 | 4.6% | Local sourcing enhanced brand loyalty |
| 2025 | 4.4% | Flavor variety attracted new consumers |
| 2026 | 4.7% | Convenience packaging gained popularity |
| 2027 | 4.4% | Functional beverages increased market interest |
| 2028 | 4.8% | Brand collaborations enhanced visibility |
| 2029 | 4.8% | Recyclable materials gained traction |
| 2030 | 4.9% | Consumer demand for transparency rose |
| 2031 | 4.7% | Social media marketing expanded outreach |
| 2032 | 5.0% | Personalization trends influenced purchases |
Note - Market size estimations and growth projections presented in this report are based on 6Wresearch’s advanced forecasting approach, validated with industry datasets as of June 2026.
Singapore Soft Drinks Packaging Market Synopsis
The strongest force shaping the Singapore soft drinks packaging market is the growing emphasis on sustainability. With consumers increasingly prioritizing eco-friendly products, traditional packaging materials are being replaced by options like aluminum cans and recycled PET bottles. This shift not only meets consumer demand but also aligns with global environmental initiatives.
In addition to sustainability, convenience plays a pivotal role in shaping market dynamics. Health-conscious consumers favor smaller, portable packaging formats that align with their on-the-go lifestyles, making innovative design crucial for capturing market share. As a result, companies are responding with creative packaging solutions that enhance user experience and accessibility.
Singapore Soft Drinks Packaging Market Key Takeaways
- The market is transitioning towards more eco-friendly packaging materials, responding to consumer preferences and regulations.
- Convenience and portability are driving the demand for smaller-sized packaging options.
- Health-oriented beverages are influencing packaging design trends, leading to a rise in low-sugar and natural ingredient options.
- Competitive pressures are necessitating continuous innovation to retain market relevance.
- Government initiatives are fostering a shift towards sustainable practices within the industry.
Evaluation of Restraints in Singapore Soft Drinks Packaging Market
Despite the promising growth, the Singapore soft drinks packaging market is restrained by several factors. The transition to sustainable materials, while essential, can present cost challenges that impact profitability. Furthermore, as consumers gravitate towards smaller, more convenient packages, companies must balance innovation with cost-efficiency to meet demand without jeopardizing their financial stability. The increasingly competitive landscape, particularly from health beverages, also complicates positioning strategies, requiring constant innovation to maintain a strong market presence.
Singapore Soft Drinks Packaging Market Trends
The ongoing trend towards sustainable packaging is evident in the growing popularity of biodegradable and recyclable materials. More brands are embracing aluminum cans and glass bottles, responding to consumer demands for environmentally friendly options. Additionally, the market is witnessing a surge in innovative designs, such as resealable packages and portion-controlled formats, catering to health-conscious consumers who prefer smaller servings without sacrificing convenience. This commitment to sustainability and innovation is likely to shape the market's trajectory in the coming years.
Singapore Soft Drinks Packaging Market Opportunities
Significant growth opportunities lie in the development of novel packaging solutions that enhance user experience and environmental sustainability. Companies focusing on integrating technology, such as QR codes for recycling information and smart packaging, can capture tech-savvy consumers’ interest. Additionally, the emphasis on health is opening doors for products packaged with natural, low-calorie beverages, thus expanding the market further. As the government continues to implement policies favoring sustainable practices, partnerships with regulatory bodies can enhance competitive advantages.
Government Initiatives in the Singapore Soft Drinks Packaging Market
The Singapore government has undertaken various initiatives to promote sustainable practices within the soft drinks packaging sector. These initiatives include stringent regulations on single-use plastics and incentives for companies that adopt eco-friendly packaging solutions. Public spending on recycling programs and educational campaigns further underscore the commitment to fostering a sustainable environment. This regulatory framework not only encourages manufacturers to pivot towards greener packaging but also engages consumers in environmentally responsible behavior.
Future Insights of the Singapore Soft Drinks Packaging Market
Looking forward to 2026-2032, the Singapore soft drinks packaging market is anticipated to continue its upward trend, propelled by ongoing advancements in sustainable materials and innovative design. As consumer preferences shift further towards eco-friendliness and health consciousness, packaging solutions will likely evolve to reflect these changes. The collaboration between manufacturers and government bodies will be crucial in shaping a more sustainable future, ultimately leading to a more resilient market capable of navigating global challenges.
Singapore Soft Drinks Packaging Market Latest Developments (May 2025 - June 2026)
In recent months, the soft drinks packaging industry in Singapore has seen a notable pivot towards incorporating sustainable practices. Many companies are ramping up efforts to develop packaging made from recycled materials and exploring new biodegradable options. Additionally, collaborations between industry leaders and environmental organizations are enhancing transparency in supply chains, contributing to greater consumer trust and engagement. The ongoing dialogue around reducing plastic waste continues to shape strategic decisions across the sector.
Singapore Soft Drinks Packaging Market - Key Attractiveness of the Report
- 10 Years of Market Numbers
- Historical Data Starting from 2022 to 2025
- Base Year: 2025
- Forecast Data until 2032
- Key Performance Indicators Impacting the Market
- Major Upcoming Developments and Projects
Key Highlights of the Report:
- Singapore Soft Drinks Packaging Market Outlook
- Market Size of Singapore Soft Drinks Packaging Market, 2025
- Forecast of Singapore Soft Drinks Packaging Market, 2032
- Historical Data and Forecast of Singapore Soft Drinks Packaging Revenues & Volume for the Period 2022-2032F
- Singapore Soft Drinks Packaging Market Trend Evolution
- Singapore Soft Drinks Packaging Market Drivers and Challenges
- Singapore Soft Drinks Packaging Price Trends
- Singapore Soft Drinks Packaging Porter's Five Forces
- Singapore Soft Drinks Packaging Industry Life Cycle
- Historical Data and Forecast of Singapore Soft Drinks Packaging Market Revenues & Volume By Material for the Period 2022-2032F
- Historical Data and Forecast of Singapore Soft Drinks Packaging Market Revenues & Volume By Paper for the Period 2022-2032F
- Historical Data and Forecast of Singapore Soft Drinks Packaging Market Revenues & Volume By Plastic for the Period 2022-2032F
- Historical Data and Forecast of Singapore Soft Drinks Packaging Market Revenues & Volume By Metal for the Period 2022-2032F
- Historical Data and Forecast of Singapore Soft Drinks Packaging Market Revenues & Volume By Glass for the Period 2022-2032F
- Historical Data and Forecast of Singapore Soft Drinks Packaging Market Revenues & Volume By for the Period 2022-2032F
- Historical Data and Forecast of Singapore Soft Drinks Packaging Market Revenues & Volume By for the Period 2022-2032F
- Historical Data and Forecast of Singapore Soft Drinks Packaging Market Revenues & Volume By Product Type for the Period 2022-2032F
- Historical Data and Forecast of Singapore Soft Drinks Packaging Market Revenues & Volume By Cans for the Period 2022-2032F
- Historical Data and Forecast of Singapore Soft Drinks Packaging Market Revenues & Volume By Boxes for the Period 2022-2032F
- Historical Data and Forecast of Singapore Soft Drinks Packaging Market Revenues & Volume By Bottles for the Period 2022-2032F
- Historical Data and Forecast of Singapore Soft Drinks Packaging Market Revenues & Volume By Cartons for the Period 2022-2032F
- Historical Data and Forecast of Singapore Soft Drinks Packaging Market Revenues & Volume By for the Period 2022-2032F
- Historical Data and Forecast of Singapore Soft Drinks Packaging Market Revenues & Volume By for the Period 2022-2032F
- Historical Data and Forecast of Singapore Soft Drinks Packaging Market Revenues & Volume By Capacity for the Period 2022-2032F
- Historical Data and Forecast of Singapore Soft Drinks Packaging Market Revenues & Volume By Up to 100 ml for the Period 2022-2032F
- Historical Data and Forecast of Singapore Soft Drinks Packaging Market Revenues & Volume By 100 to 250 ml for the Period 2022-2032F
- Historical Data and Forecast of Singapore Soft Drinks Packaging Market Revenues & Volume By 250 to 500 ml for the Period 2022-2032F
- Historical Data and Forecast of Singapore Soft Drinks Packaging Market Revenues & Volume By 500 to 1000 ml for the Period 2022-2032F
- Historical Data and Forecast of Singapore Soft Drinks Packaging Market Revenues & Volume By 1000 to 2000 ml for the Period 2022-2032F
- Historical Data and Forecast of Singapore Soft Drinks Packaging Market Revenues & Volume By Above 2000 ml for the Period 2022-2032F
- Historical Data and Forecast of Singapore Soft Drinks Packaging Market Revenues & Volume By Application for the Period 2022-2032F
- Historical Data and Forecast of Singapore Soft Drinks Packaging Market Revenues & Volume By Carbonated soft drinks for the Period 2022-2032F
- Historical Data and Forecast of Singapore Soft Drinks Packaging Market Revenues & Volume By Functional Drinks for the Period 2022-2032F
- Historical Data and Forecast of Singapore Soft Drinks Packaging Market Revenues & Volume By Sport Drinks for the Period 2022-2032F
- Historical Data and Forecast of Singapore Soft Drinks Packaging Market Revenues & Volume By Energy Drinks for the Period 2022-2032F
- Historical Data and Forecast of Singapore Soft Drinks Packaging Market Revenues & Volume By Others for the Period 2022-2032F
- Historical Data and Forecast of Singapore Soft Drinks Packaging Market Revenues & Volume By Juices for the Period 2022-2032F
- Singapore Soft Drinks Packaging Import Export Trade Statistics
- Market Opportunity Assessment By Material
- Market Opportunity Assessment By Product Type
- Market Opportunity Assessment By Capacity
- Market Opportunity Assessment By Application
- Singapore Soft Drinks Packaging Top Companies Market Share
- Singapore Soft Drinks Packaging Competitive Benchmarking By Technical and Operational Parameters
- Singapore Soft Drinks Packaging Company Profiles
- Singapore Soft Drinks Packaging Key Strategic Recommendations
Singapore Soft Drinks Packaging Market - Frequently Asked Questions
The growth is primarily influenced by consumer preferences for sustainable and convenient packaging. The increasing focus on eco-friendly materials and health-conscious beverages is steering innovation in the market.
The market was estimated at USD 472 Million in 2025 and is projected to reach USD 622 Million by 2032, growing at a CAGR of 4.0% from 2026 to 2032.
Consumers are increasingly seeking smaller, portable packaging options that align with their on-the-go lifestyles. This shift reflects broader health trends and is prompting brands to innovate with design and functionality.
The Singapore government is actively promoting sustainable packaging through regulations against single-use plastics and incentives for eco-friendly solutions, guiding industry practices toward sustainability.
Opportunities are arising in the development of innovative packaging solutions that combine sustainability with consumer convenience, such as smart packaging and resealable formats, aligning with evolving market demands.
6Wresearch actively monitors the Singapore Soft Drinks Packaging Market and publishes its comprehensive annual report, highlighting emerging trends, growth drivers, revenue analysis, and forecast outlook. Our insights help businesses to make data-backed strategic decisions with ongoing market dynamics. Our analysts track relevent industries related to the Singapore Soft Drinks Packaging Market, allowing our clients with actionable intelligence and reliable forecasts tailored to emerging regional needs.
Yes, we provide customisation as per your requirements. To learn more, feel free to contact us on sales@6wresearch.com
1 Executive Summary |
2 Introduction |
2.1 Key Highlights of the Report |
2.2 Report Description |
2.3 Market Scope & Segmentation |
2.4 Research Methodology |
2.5 Assumptions |
3 Singapore Soft Drinks Packaging Market Overview |
3.1 Singapore Country Macro Economic Indicators |
3.2 Singapore Soft Drinks Packaging Market Revenues & Volume, 2022 & 2032F |
3.3 Singapore Soft Drinks Packaging Market - Industry Life Cycle |
3.4 Singapore Soft Drinks Packaging Market - Porter's Five Forces |
3.5 Singapore Soft Drinks Packaging Market Revenues & Volume Share, By Material, 2022 & 2032F |
3.6 Singapore Soft Drinks Packaging Market Revenues & Volume Share, By Product Type, 2022 & 2032F |
3.7 Singapore Soft Drinks Packaging Market Revenues & Volume Share, By Capacity, 2022 & 2032F |
3.8 Singapore Soft Drinks Packaging Market Revenues & Volume Share, By Application, 2022 & 2032F |
4 Singapore Soft Drinks Packaging Market Dynamics |
4.1 Impact Analysis |
4.2 Market Drivers |
4.2.1 Increasing consumer preference for convenience and on-the-go consumption |
4.2.2 Growing demand for healthier beverage options and functional drinks |
4.2.3 Rising disposable income and changing lifestyles driving consumption of soft drinks |
4.3 Market Restraints |
4.3.1 Stringent regulations and environmental concerns regarding plastic packaging |
4.3.2 Volatility in raw material prices impacting production costs |
4.3.3 Intense competition among soft drink brands leading to pricing pressures |
5 Singapore Soft Drinks Packaging Market Trends |
6 Singapore Soft Drinks Packaging Market, By Types |
6.1 Singapore Soft Drinks Packaging Market, By Material |
6.1.1 Overview and Analysis |
6.1.2 Singapore Soft Drinks Packaging Market Revenues & Volume, By Material, 2022-2032F |
6.1.3 Singapore Soft Drinks Packaging Market Revenues & Volume, By Paper, 2022-2032F |
6.1.4 Singapore Soft Drinks Packaging Market Revenues & Volume, By Plastic, 2022-2032F |
6.1.5 Singapore Soft Drinks Packaging Market Revenues & Volume, By Metal, 2022-2032F |
6.1.6 Singapore Soft Drinks Packaging Market Revenues & Volume, By Glass, 2022-2032F |
6.1.7 Singapore Soft Drinks Packaging Market Revenues & Volume, By , 2022-2032F |
6.1.8 Singapore Soft Drinks Packaging Market Revenues & Volume, By , 2022-2032F |
6.2 Singapore Soft Drinks Packaging Market, By Product Type |
6.2.1 Overview and Analysis |
6.2.2 Singapore Soft Drinks Packaging Market Revenues & Volume, By Cans, 2022-2032F |
6.2.3 Singapore Soft Drinks Packaging Market Revenues & Volume, By Boxes, 2022-2032F |
6.2.4 Singapore Soft Drinks Packaging Market Revenues & Volume, By Bottles, 2022-2032F |
6.2.5 Singapore Soft Drinks Packaging Market Revenues & Volume, By Cartons, 2022-2032F |
6.2.6 Singapore Soft Drinks Packaging Market Revenues & Volume, By , 2022-2032F |
6.2.7 Singapore Soft Drinks Packaging Market Revenues & Volume, By , 2022-2032F |
6.3 Singapore Soft Drinks Packaging Market, By Capacity |
6.3.1 Overview and Analysis |
6.3.2 Singapore Soft Drinks Packaging Market Revenues & Volume, By Up to 100 ml, 2022-2032F |
6.3.3 Singapore Soft Drinks Packaging Market Revenues & Volume, By 100 to 250 ml, 2022-2032F |
6.3.4 Singapore Soft Drinks Packaging Market Revenues & Volume, By 250 to 500 ml, 2022-2032F |
6.3.5 Singapore Soft Drinks Packaging Market Revenues & Volume, By 500 to 1000 ml, 2022-2032F |
6.3.6 Singapore Soft Drinks Packaging Market Revenues & Volume, By 1000 to 2000 ml, 2022-2032F |
6.3.7 Singapore Soft Drinks Packaging Market Revenues & Volume, By Above 2000 ml, 2022-2032F |
6.4 Singapore Soft Drinks Packaging Market, By Application |
6.4.1 Overview and Analysis |
6.4.2 Singapore Soft Drinks Packaging Market Revenues & Volume, By Carbonated soft drinks, 2022-2032F |
6.4.3 Singapore Soft Drinks Packaging Market Revenues & Volume, By Functional Drinks, 2022-2032F |
6.4.4 Singapore Soft Drinks Packaging Market Revenues & Volume, By Sport Drinks, 2022-2032F |
6.4.5 Singapore Soft Drinks Packaging Market Revenues & Volume, By Energy Drinks, 2022-2032F |
6.4.6 Singapore Soft Drinks Packaging Market Revenues & Volume, By Others, 2022-2032F |
6.4.7 Singapore Soft Drinks Packaging Market Revenues & Volume, By Juices, 2022-2032F |
7 Singapore Soft Drinks Packaging Market Import-Export Trade Statistics |
7.1 Singapore Soft Drinks Packaging Market Export to Major Countries |
7.2 Singapore Soft Drinks Packaging Market Imports from Major Countries |
8 Singapore Soft Drinks Packaging Market Key Performance Indicators |
8.1 Percentage of soft drinks packaged in eco-friendly materials |
8.2 Adoption rate of innovative packaging solutions in the soft drinks market |
8.3 Consumer perception and awareness of sustainability practices in soft drinks packaging |
8.4 Investment in research and development for sustainable packaging solutions |
8.5 Rate of new product launches with packaging innovations |
9 Singapore Soft Drinks Packaging Market - Opportunity Assessment |
9.1 Singapore Soft Drinks Packaging Market Opportunity Assessment, By Material, 2022 & 2032F |
9.2 Singapore Soft Drinks Packaging Market Opportunity Assessment, By Product Type, 2022 & 2032F |
9.3 Singapore Soft Drinks Packaging Market Opportunity Assessment, By Capacity, 2022 & 2032F |
9.4 Singapore Soft Drinks Packaging Market Opportunity Assessment, By Application, 2022 & 2032F |
10 Singapore Soft Drinks Packaging Market - Competitive Landscape |
10.1 Singapore Soft Drinks Packaging Market Revenue Share, By Companies, 2025 |
10.2 Singapore Soft Drinks Packaging Market Competitive Benchmarking, By Operating and Technical Parameters |
11 Company Profiles |
12 Recommendations |
13 Disclaimer |
Global Go To Market Strategy - 2030
Export potential enables firms to identify high-growth global markets with greater confidence by combining advanced trade intelligence with a structured quantitative methodology. The framework analyzes emerging demand trends and country-level import patterns while integrating macroeconomic and trade datasets such as GDP and population forecasts, bilateral import–export flows, tariff structures, elasticity differentials between developed and developing economies, geographic distance, and import demand projections. Using weighted trade values from 2020–2024 as the base period to project country-to-country export potential for 2030, these inputs are operationalized through calculated drivers such as gravity model parameters, tariff impact factors, and projected GDP per-capita growth. Through an analysis of hidden potentials, demand hotspots, and market conditions that are most favorable to success, this method enables firms to focus on target countries, maximize returns, and global expansion with data, backed by accuracy.
By factoring in the projected importer demand gap that is currently unmet and could be potential opportunity, it identifies the potential for the Exporter (Country) among 190 countries, against the general trade analysis, which identifies the biggest importer or exporter.
To discover high-growth global markets and optimize your business strategy:
Click Here
Pricing
- Single User License$ 1,995
- Department License$ 2,400
- Site License$ 3,120
- Global License$ 3,795

Leadership Perspectives from Industry Events
Search
Thought Leadership and Analyst Meet


Our Clients
6WResearch In News
- India Air Conditioner Market Set for Strong Rebound in 2026 After Weather-Led Correction and GST-Driven Recovery: 6Wresearch
- ADAS in India: How Automatic Emergency Braking, Blind Spot Detection & Driver Monitoring are Transforming Road Safety
- Doha a strategic location for EV manufacturing hub: IPA Qatar
- Demand for luxury TVs surging in the GCC, says Samsung
- Empowering Growth: The Thriving Journey of Bangladesh’s Cable Industry
- Demand for luxury TVs surging in the GCC, says Samsung
Latest Reports
- Poland Fire Protection Systems Market (2026-2032)
- Cape Verde Portable Hand-Thrown Extinguisher Market (2026-2032)
- Canada Portable Hand-Thrown Extinguisher Market (2026-2032)
- Cameroon Portable Hand-Thrown Extinguisher Market (2026-2032)
- Burundi Portable Hand-Thrown Extinguisher Market (2026-2032)
- Burkina Faso Portable Hand-Thrown Extinguisher Market (2026-2032)
- Bulgaria Portable Hand-Thrown Extinguisher Market (2026-2032)
- Brunei Portable Hand-Thrown Extinguisher Market (2026-2032)
- Botswana Portable Hand-Thrown Extinguisher Market (2026-2032)
- Bosnia and Herzegovina Portable Hand-Thrown Extinguisher Market (2026-2032)
Industry Events and Analyst Meet

HIMTEX 2026

India Refining Summit 2026

India EV Show 2026

EV tech India Expo 2026

Auto Tech Asia 2026
Whitepaper
- Middle East & Africa Commercial Security Market Click here to view more.
- Middle East & Africa Fire Safety Systems & Equipment Market Click here to view more.
- GCC Drone Market Click here to view more.
- Middle East Lighting Fixture Market Click here to view more.
- GCC Physical & Perimeter Security Market Click here to view more.