Slovenia Rare Earth & Products Market (2026-2032) | Segmentation, Outlook, Growth, Companies, Revenue, Value, Analysis, Share, Forecast, Size, Industry & Trends
Market Forecast By Product Types (Cerium, Dysprosium, Erbium, Europium, Gadolinium, Holmium, Lanthanum, Others), By Applications (Magnets, Catalysts, Metallurgy, Polishing, Glass, Phosphors, Ceramics, Others) And Competitive Landscape
| Product Code: ETC4654968 | Publication Date: Nov 2023 | Updated Date: Apr 2026 | Product Type: Market Research Report | |
| Publisher: 6Wresearch | Author: Shubham Padhi | No. of Pages: 60 | No. of Figures: 30 | No. of Tables: 5 |
Slovenia Rare Earth & Products Market - Import Trends (2019-2025)
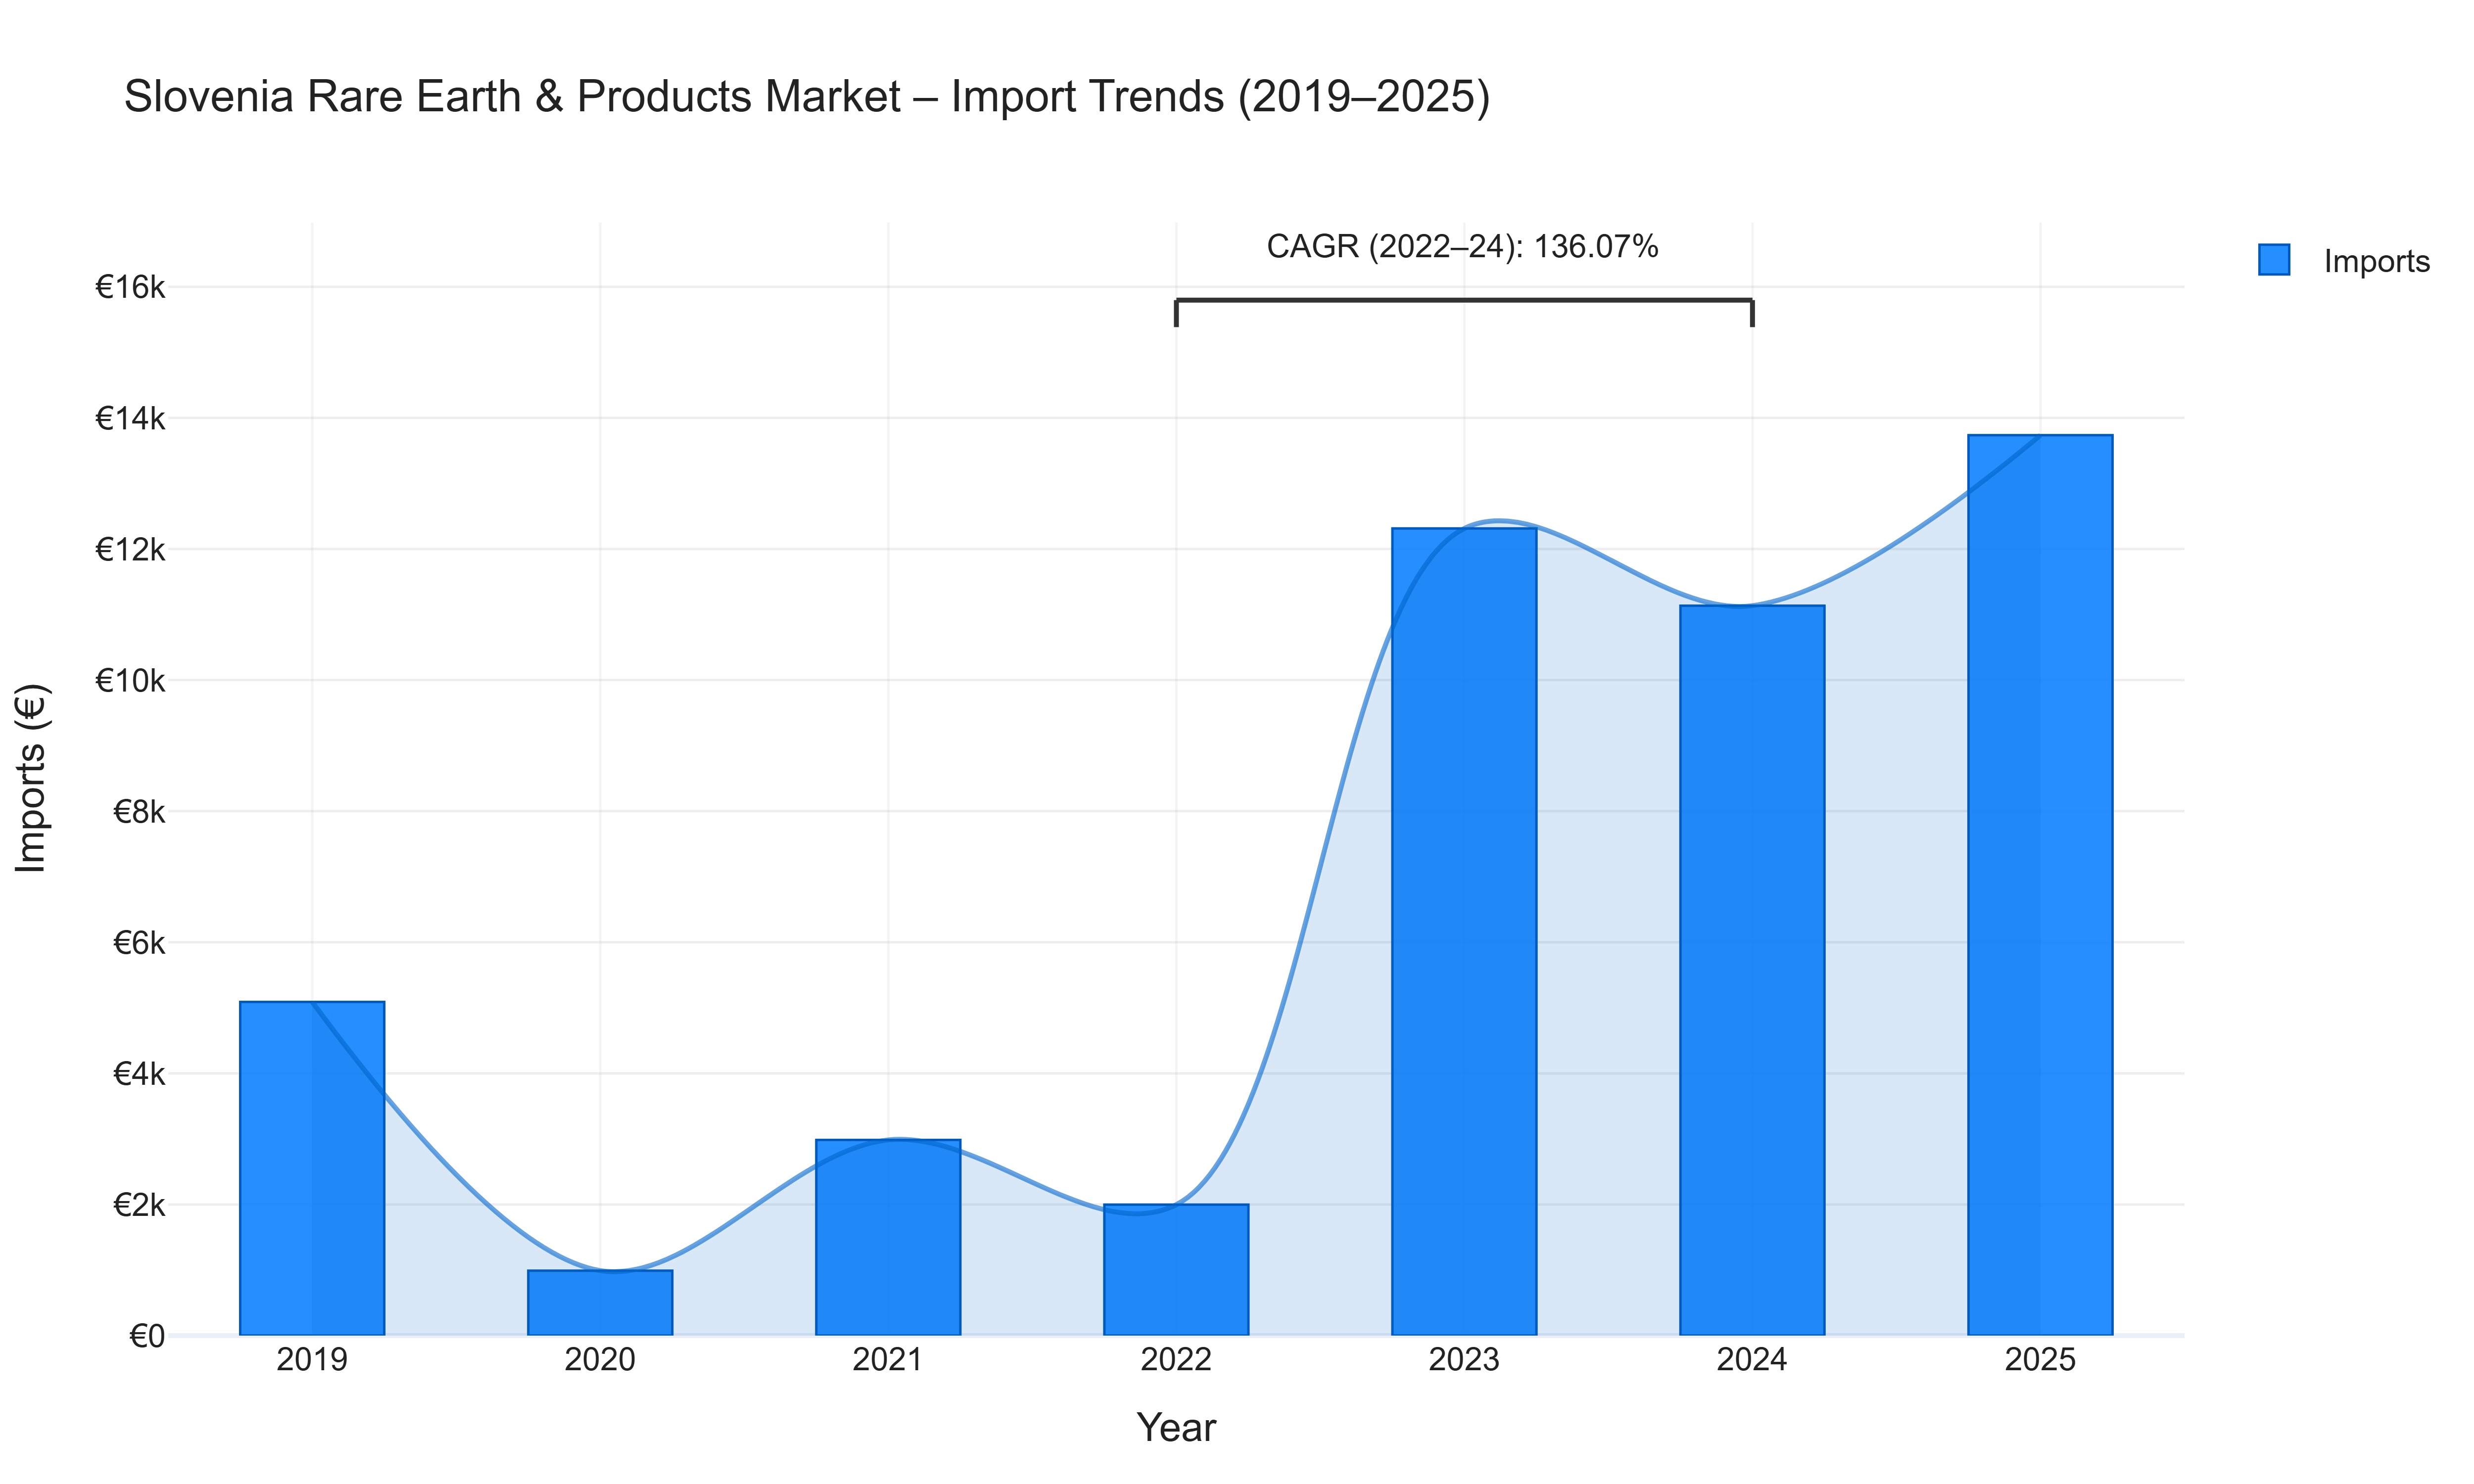
In the Slovenia Rare Earth & Products Market, Import Values have shown significant fluctuations over the years. The Import Value witnessed a drastic decline in 2020, dropping by 80.53%, attributed to global supply chain disruptions and reduced demand amid the pandemic. However, a remarkable recovery was observed in 2021 with a growth of 201.21%, indicating a resurgence in market activity. The Import Value peaked in 2023 at €12.31 thousand, showcasing a substantial increase of 516.32%, possibly driven by renewed demand and strategic sourcing initiatives. The subsequent slight decline in 2024 by 9.57% could be linked to stabilizing market conditions post-recovery. The calculated CAGR of 136.07% from 2022 to 2024 underscores the market's overall growth trajectory, reflecting the market's resilience and potential for expansion in the coming years.
Key Highlights of the Report:
- Slovenia Rare Earth & Products Market Outlook
- Market Size of Slovenia Rare Earth & Products Market, 2025
- Forecast of Slovenia Rare Earth & Products Market, 2032
- Historical Data and Forecast of Slovenia Rare Earth & Products Revenues & Volume for the Period 2022-2032F
- Slovenia Rare Earth & Products Market Trend Evolution
- Slovenia Rare Earth & Products Market Drivers and Challenges
- Slovenia Rare Earth & Products Price Trends
- Slovenia Rare Earth & Products Porter`s Five Forces
- Slovenia Rare Earth & Products Industry Life Cycle
- Historical Data and Forecast of Slovenia Rare Earth & Products Market Revenues & Volume By Product Types for the Period 2022-2032F
- Historical Data and Forecast of Slovenia Rare Earth & Products Market Revenues & Volume By Cerium for the Period 2022-2032F
- Historical Data and Forecast of Slovenia Rare Earth & Products Market Revenues & Volume By Dysprosium for the Period 2022-2032F
- Historical Data and Forecast of Slovenia Rare Earth & Products Market Revenues & Volume By Erbium for the Period 2022-2032F
- Historical Data and Forecast of Slovenia Rare Earth & Products Market Revenues & Volume By Europium for the Period 2022-2032F
- Historical Data and Forecast of Slovenia Rare Earth & Products Market Revenues & Volume By Gadolinium for the Period 2022-2032F
- Historical Data and Forecast of Slovenia Rare Earth & Products Market Revenues & Volume By Holmium for the Period 2022-2032F
- Historical Data and Forecast of Slovenia Rare Earth & Products Market Revenues & Volume By Lanthanum for the Period 2022-2032F
- Historical Data and Forecast of Slovenia Cerium Rare Earth & Products Market Revenues & Volume By Others for the Period 2022-2032F
- Historical Data and Forecast of Slovenia Rare Earth & Products Market Revenues & Volume By Applications for the Period 2022-2032F
- Historical Data and Forecast of Slovenia Rare Earth & Products Market Revenues & Volume By Magnets for the Period 2022-2032F
- Historical Data and Forecast of Slovenia Rare Earth & Products Market Revenues & Volume By Catalysts for the Period 2022-2032F
- Historical Data and Forecast of Slovenia Rare Earth & Products Market Revenues & Volume By Metallurgy for the Period 2022-2032F
- Historical Data and Forecast of Slovenia Rare Earth & Products Market Revenues & Volume By Polishing for the Period 2022-2032F
- Historical Data and Forecast of Slovenia Rare Earth & Products Market Revenues & Volume By Glass for the Period 2022-2032F
- Historical Data and Forecast of Slovenia Rare Earth & Products Market Revenues & Volume By Phosphors for the Period 2022-2032F
- Historical Data and Forecast of Slovenia Rare Earth & Products Market Revenues & Volume By Ceramics for the Period 2022-2032F
- Historical Data and Forecast of Slovenia Rare Earth & Products Market Revenues & Volume By Others for the Period 2022-2032F
- Slovenia Rare Earth & Products Import Export Trade Statistics
- Market Opportunity Assessment By Product Types
- Market Opportunity Assessment By Applications
- Slovenia Rare Earth & Products Top Companies Market Share
- Slovenia Rare Earth & Products Competitive Benchmarking By Technical and Operational Parameters
- Slovenia Rare Earth & Products Company Profiles
- Slovenia Rare Earth & Products Key Strategic Recommendations
Frequently Asked Questions About the Market Study (FAQs):
6Wresearch actively monitors the Slovenia Rare Earth & Products Market and publishes its comprehensive annual report, highlighting emerging trends, growth drivers, revenue analysis, and forecast outlook. Our insights help businesses to make data-backed strategic decisions with ongoing market dynamics. Our analysts track relevent industries related to the Slovenia Rare Earth & Products Market, allowing our clients with actionable intelligence and reliable forecasts tailored to emerging regional needs.
Yes, we provide customisation as per your requirements. To learn more, feel free to contact us on sales@6wresearch.com
1 Executive Summary |
2 Introduction |
2.1 Key Highlights of the Report |
2.2 Report Description |
2.3 Market Scope & Segmentation |
2.4 Research Methodology |
2.5 Assumptions |
3 Slovenia Rare Earth & Products Market Overview |
3.1 Slovenia Country Macro Economic Indicators |
3.2 Slovenia Rare Earth & Products Market Revenues & Volume, 2022 & 2032F |
3.3 Slovenia Rare Earth & Products Market - Industry Life Cycle |
3.4 Slovenia Rare Earth & Products Market - Porter's Five Forces |
3.5 Slovenia Rare Earth & Products Market Revenues & Volume Share, By Product Types, 2022 & 2032F |
3.6 Slovenia Rare Earth & Products Market Revenues & Volume Share, By Applications, 2022 & 2032F |
4 Slovenia Rare Earth & Products Market Dynamics |
4.1 Impact Analysis |
4.2 Market Drivers |
4.2.1 Increasing demand for rare earth elements in various industries such as electronics, renewable energy, and automotive. |
4.2.2 Government initiatives to promote domestic production and reduce reliance on imports. |
4.2.3 Technological advancements leading to more efficient extraction and processing of rare earth elements. |
4.3 Market Restraints |
4.3.1 Limited domestic reserves of rare earth elements in Slovenia. |
4.3.2 Environmental concerns associated with the mining and processing of rare earth elements. |
4.3.3 Volatility in global rare earth prices due to geopolitical factors and trade tensions. |
5 Slovenia Rare Earth & Products Market Trends |
6 Slovenia Rare Earth & Products Market Segmentations |
6.1 Slovenia Rare Earth & Products Market, By Product Types |
6.1.1 Overview and Analysis |
6.1.2 Slovenia Rare Earth & Products Market Revenues & Volume, By Cerium, 2022-2032F |
6.1.3 Slovenia Rare Earth & Products Market Revenues & Volume, By Dysprosium, 2022-2032F |
6.1.4 Slovenia Rare Earth & Products Market Revenues & Volume, By Erbium, 2022-2032F |
6.1.5 Slovenia Rare Earth & Products Market Revenues & Volume, By Europium, 2022-2032F |
6.1.6 Slovenia Rare Earth & Products Market Revenues & Volume, By Gadolinium, 2022-2032F |
6.1.7 Slovenia Rare Earth & Products Market Revenues & Volume, By Holmium, 2022-2032F |
6.1.9 Slovenia Rare Earth & Products Market Revenues & Volume, By Others, 2022-2032F |
6.1.10 Slovenia Rare Earth & Products Market Revenues & Volume, By Others, 2022-2032F |
6.2 Slovenia Rare Earth & Products Market, By Applications |
6.2.1 Overview and Analysis |
6.2.2 Slovenia Rare Earth & Products Market Revenues & Volume, By Magnets, 2022-2032F |
6.2.3 Slovenia Rare Earth & Products Market Revenues & Volume, By Catalysts, 2022-2032F |
6.2.4 Slovenia Rare Earth & Products Market Revenues & Volume, By Metallurgy, 2022-2032F |
6.2.5 Slovenia Rare Earth & Products Market Revenues & Volume, By Polishing, 2022-2032F |
6.2.6 Slovenia Rare Earth & Products Market Revenues & Volume, By Glass, 2022-2032F |
6.2.7 Slovenia Rare Earth & Products Market Revenues & Volume, By Phosphors, 2022-2032F |
6.2.8 Slovenia Rare Earth & Products Market Revenues & Volume, By Others, 2022-2032F |
6.2.9 Slovenia Rare Earth & Products Market Revenues & Volume, By Others, 2022-2032F |
7 Slovenia Rare Earth & Products Market Import-Export Trade Statistics |
7.1 Slovenia Rare Earth & Products Market Export to Major Countries |
7.2 Slovenia Rare Earth & Products Market Imports from Major Countries |
8 Slovenia Rare Earth & Products Market Key Performance Indicators |
8.1 Research and development investments in rare earth extraction and processing technologies. |
8.2 Number of patents filed for new rare earth products or applications. |
8.3 Environmental impact assessments and sustainability initiatives in rare earth mining operations. |
9 Slovenia Rare Earth & Products Market - Opportunity Assessment |
9.1 Slovenia Rare Earth & Products Market Opportunity Assessment, By Product Types, 2022 & 2032F |
9.2 Slovenia Rare Earth & Products Market Opportunity Assessment, By Applications, 2022 & 2032F |
10 Slovenia Rare Earth & Products Market - Competitive Landscape |
10.1 Slovenia Rare Earth & Products Market Revenue Share, By Companies, 2025 |
10.2 Slovenia Rare Earth & Products Market Competitive Benchmarking, By Operating and Technical Parameters |
11 Company Profiles |
12 Recommendations | 13 Disclaimer |
Export potential assessment - trade Analytics for 2030
Export potential enables firms to identify high-growth global markets with greater confidence by combining advanced trade intelligence with a structured quantitative methodology. The framework analyzes emerging demand trends and country-level import patterns while integrating macroeconomic and trade datasets such as GDP and population forecasts, bilateral import–export flows, tariff structures, elasticity differentials between developed and developing economies, geographic distance, and import demand projections. Using weighted trade values from 2020–2024 as the base period to project country-to-country export potential for 2030, these inputs are operationalized through calculated drivers such as gravity model parameters, tariff impact factors, and projected GDP per-capita growth. Through an analysis of hidden potentials, demand hotspots, and market conditions that are most favorable to success, this method enables firms to focus on target countries, maximize returns, and global expansion with data, backed by accuracy.
By factoring in the projected importer demand gap that is currently unmet and could be potential opportunity, it identifies the potential for the Exporter (Country) among 190 countries, against the general trade analysis, which identifies the biggest importer or exporter.
To discover high-growth global markets and optimize your business strategy:
Click Here
Pricing
- Single User License$ 1,995
- Department License$ 2,400
- Site License$ 3,120
- Global License$ 3,795

Search
Thought Leadership and Analyst Meet


Our Clients
Latest Reports
- India Ultrasonic Smart Water Meter Market (2026-2032) | Outlook, Competition, Drivers, Trends, Demand, Competitive, Strategic Insights, Companies, Challenges, Strategy, Consumer Insights, Analysis, Opportunities, Growth, Size, Share, Industry, Revenue, Segments, Value, Segmentation, Supply, Forecast, Restraints,
- India Electromagnetic Bulk Flow Meter Market (2026-2032) | Analysis, Challenges, Strategic Insights, Supply, Forecast, Growth, Share, Consumer Insights, Competitive, Value, Outlook, Size & Demand,
- India Battery Powered Bulk Flow Meter Market (2026-2032) | Outlook, Analysis, Competitive Landscape, Growth, Size, Trends, Value, Revenue, Companies, Segmentation, Share & Forecast
- Bosnia and Herzegovina Fuel-Efficient Winglets Market (2026-2032) | Growth, Competition, Strategy, Restraints, Trends, Challenges, segmentation, Value, Outlook, Investment Opportunities, Analysis, Revenue, Companies, Insights, Pricing, Size, Drivers, Demand, Share, Forecast
- Canada Cloud CFD Market (2026-2032) | Size & Revenue, Industry, Growth, Competitive Landscape, Forecast, Segmentation, Value, Outlook, Trends, Share, Analysis, Companies
- Taiwan Food Delivery Platform Market (2026-2032) | Companies, Outlook, Analysis, Trends, Value, Revenue, Segmentation, Share, Forecast, Competitive Landscape, Growth, Size & Forecast
- United Kingdom (UK) Long-term Care Insurance Market (2026-2032) | Growth, Share, Consumer Insights, Drivers, Opportunities, Competition, Pricing Analysis, Segments, Restraints, Companies, Competitive, Value, Outlook, Size, Demand, Analysis, Challenges, Strategic Insights, Investment Trends, Revenue, Trends, Supply, Forecast
- United Kingdom (UK) Long Term Care Market (2026-2032) | Companies, Outlook, Analysis, Trends, Value, Revenue, Segmentation, Share, Forecast, Competitive Landscape, Growth, Size & Forecast
- Iraq Insulation and Waterproofing Market (2026-2032) | Outlook, Drivers, Growth, Size, Share, Industry, Revenue, Trends, Demand, Competitive, Strategic Insights, Opportunities, Segments, Companies, Challenges, Strategy, Consumer Insights, Analysis, Investment Trends, Value, Segmentation, Forecast, Restraints
- India Switchgear Market Outlook (2026-2032) | Size, Share, Trends, Growth, Revenue, Forecast, Analysis, Value, Outlook
Industry Events and Analyst Meet

HIMTEX 2026

India Refining Summit 2026

India EV Show 2026

EV tech India Expo 2026

Auto Tech Asia 2026
Whitepaper
- Middle East & Africa Commercial Security Market Click here to view more.
- Middle East & Africa Fire Safety Systems & Equipment Market Click here to view more.
- GCC Drone Market Click here to view more.
- Middle East Lighting Fixture Market Click here to view more.
- GCC Physical & Perimeter Security Market Click here to view more.
6WResearch In News
- Doha a strategic location for EV manufacturing hub: IPA Qatar
- Demand for luxury TVs surging in the GCC, says Samsung
- Empowering Growth: The Thriving Journey of Bangladesh’s Cable Industry
- Demand for luxury TVs surging in the GCC, says Samsung
- Video call with a traditional healer? Once unthinkable, it’s now common in South Africa
- Intelligent Buildings To Smooth GCC’s Path To Net Zero