Slovenia Salicylic Acid Market (2026-2032) | Revenue, Segmentation, Analysis, Share, Growth, Companies, Value, Size, Industry, Trends, Forecast & Outlook
Market Forecast By Application (Pharmaceutical, Food & Preservatives, Cosmetics, Others) And Competitive Landscape
| Product Code: ETC4724926 | Publication Date: Nov 2023 | Updated Date: Apr 2026 | Product Type: Market Research Report | |
| Publisher: 6Wresearch | Author: Shubham Padhi | No. of Pages: 60 | No. of Figures: 30 | No. of Tables: 5 |
Slovenia Salicylic Acid Market Size (2020-2030)
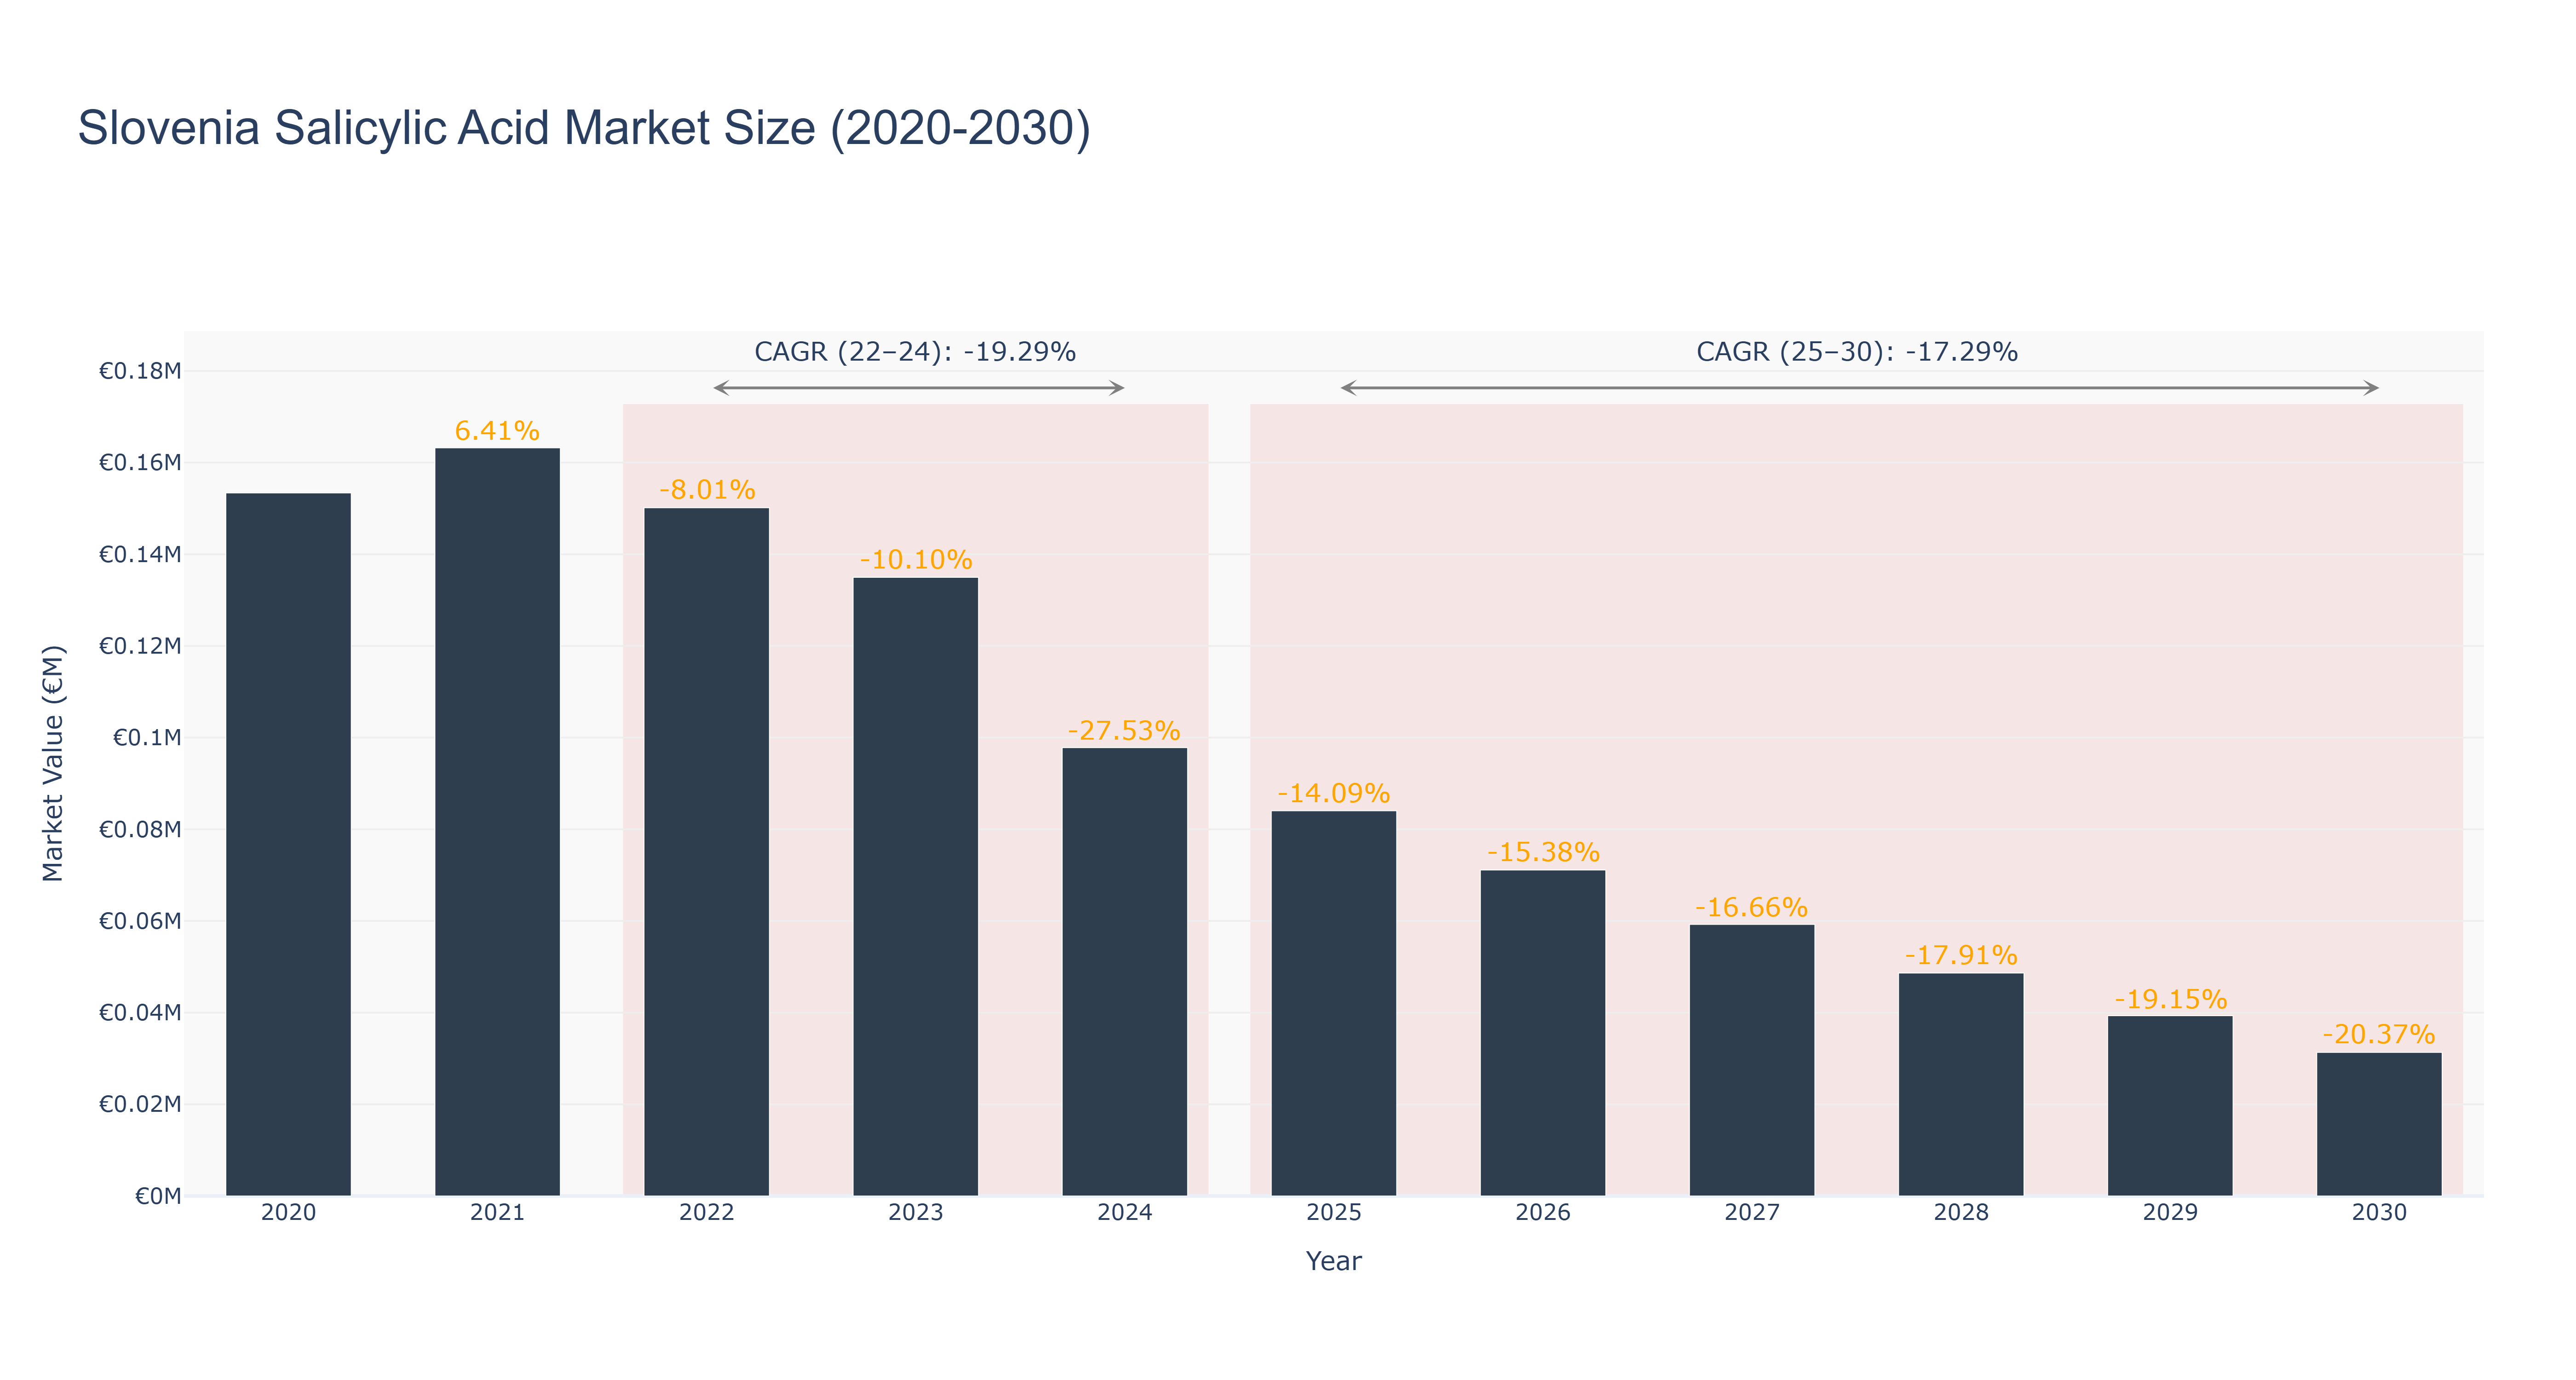
The Slovenia Salicylic Acid Market experienced a peak market size of €163.22 thousand in 2021, followed by a decline to €150.15 thousand in 2022 and further drops to €97.82 thousand by 2024, reflecting a negative Compound Annual Growth Rate (CAGR) of -19.29% during the actual period from 2022 to 2024. The downward trend is attributed to decreasing demand in the pharmaceutical and cosmetic sectors, exacerbated by economic uncertainties and shifts towards alternative ingredients. Looking ahead, the forecasted market size is projected to decrease further, reaching €31.32 thousand by 2030, with a CAGR of -17.29% from 2025 to 2030. This decline may be influenced by ongoing regulatory changes and a shift in consumer preferences towards more natural compounds. Future prospects in the market will heavily rely on innovation and potential collaborations within the industry to revitalize interest and application of salicylic acid in various formulations.
Slovenia Salicylic Acid Market: Production & Trade Performance (2019-2025)
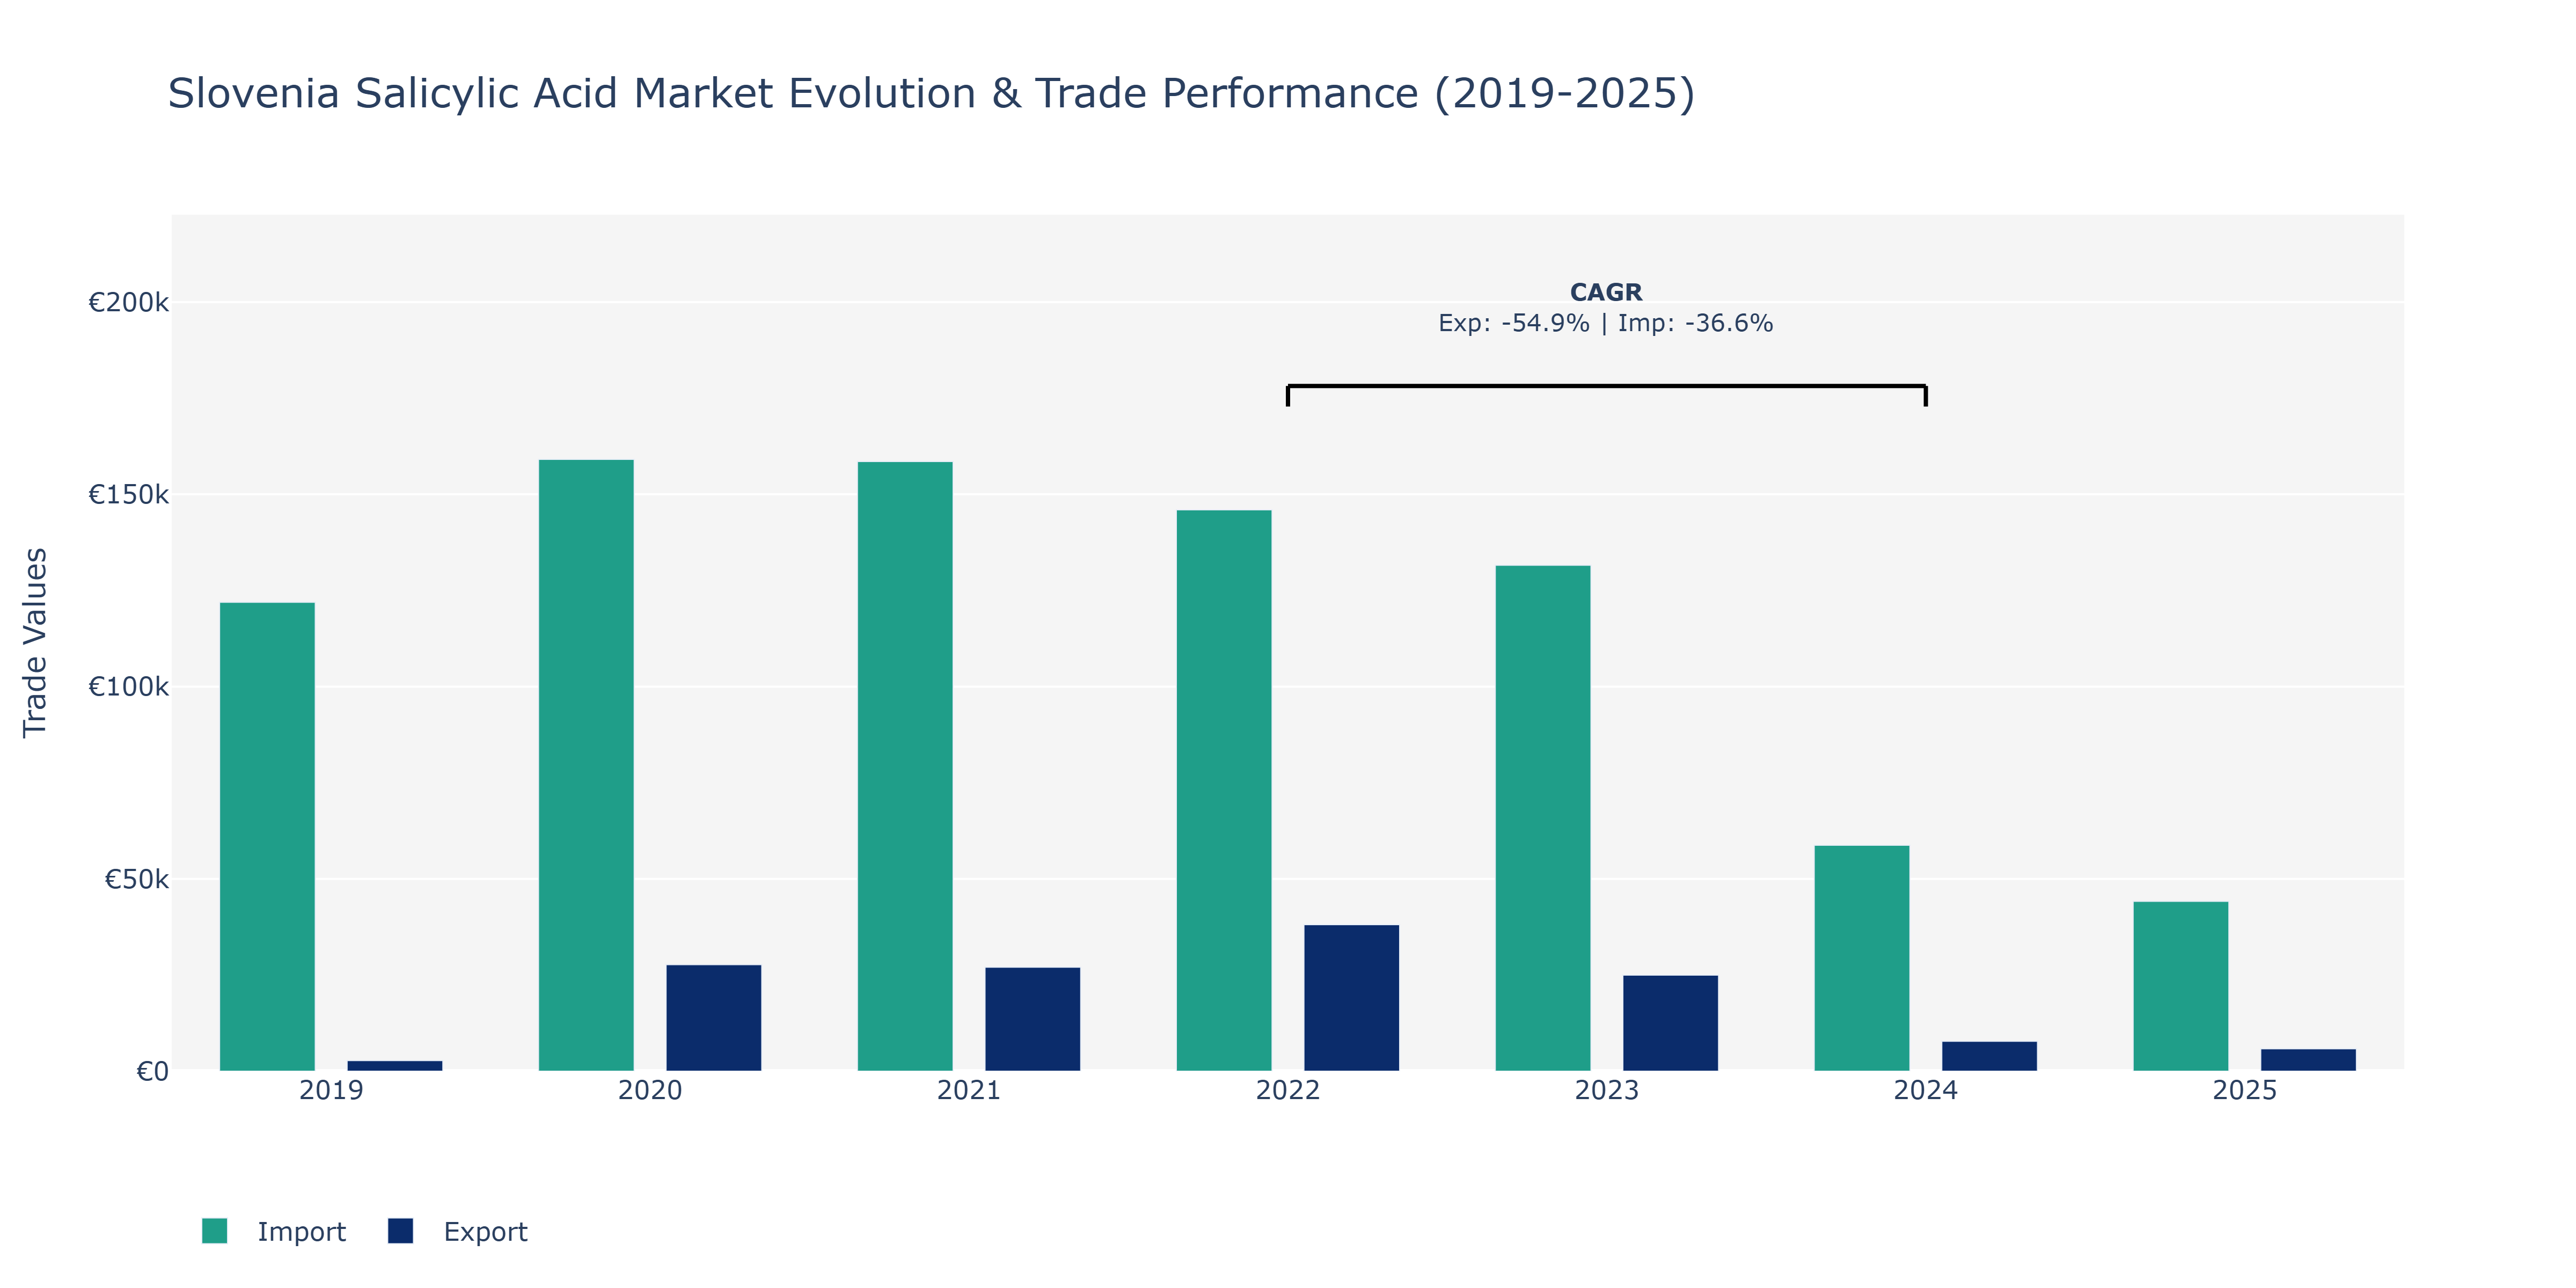
The Slovenia Salicylic Acid Market witnessed varying trends in Exports and Imports over the years. Between 2019 and 2020, Exports surged from €2.75 thousand to €27.69 thousand, marking a substantial increase driven by potential market demand and production capacity enhancements. Imports followed a similar upward trajectory, growing from €121.93 thousand to €159.09 thousand during the same period, reflecting increased raw material procurement for manufacturing processes. However, in 2021, both Exports and Imports experienced a slight decline, settling at €27.02 thousand and €158.54 thousand, respectively, possibly influenced by global economic factors impacting trade flows. The year 2022 saw a notable resurgence in Exports to €38.1 thousand, possibly indicating market stabilization efforts and enhanced competitiveness. Conversely, Imports declined to €145.98 thousand, potentially reflecting supply chain optimizations and cost-saving strategies. By 2024, Exports decreased to €7.76 thousand, while Imports notably dropped to €58.76 thousand, showcasing potential market repositioning strategies and demand fluctuations. In 2025, Exports and Imports further decreased to €5.84 thousand and €44.18 thousand, respectively, reflecting ongoing market adjustments. These fluctuations could be influenced by factors such as evolving global market dynamics, regulatory changes impacting trade policies, and shifts in consumer preferences towards sustainable products. To maintain market competitiveness, stakeholders may need to adapt strategies focusing on innovation, cost-efficiency, and market diversification.
Key Highlights of the Report:
- Slovenia Salicylic Acid Market Outlook
- Market Size of Slovenia Salicylic Acid Market, 2025
- Forecast of Slovenia Salicylic Acid Market, 2032
- Historical Data and Forecast of Slovenia Salicylic Acid Revenues & Volume for the Period 2022-2032F
- Slovenia Salicylic Acid Market Trend Evolution
- Slovenia Salicylic Acid Market Drivers and Challenges
- Slovenia Salicylic Acid Price Trends
- Slovenia Salicylic Acid Porter`s Five Forces
- Slovenia Salicylic Acid Industry Life Cycle
- Historical Data and Forecast of Slovenia Salicylic Acid Market Revenues & Volume By Application for the Period 2022-2032F
- Historical Data and Forecast of Slovenia Salicylic Acid Market Revenues & Volume By Pharmaceutical for the Period 2022-2032F
- Historical Data and Forecast of Slovenia Salicylic Acid Market Revenues & Volume By Food & Preservatives for the Period 2022-2032F
- Historical Data and Forecast of Slovenia Salicylic Acid Market Revenues & Volume By Cosmetics for the Period 2022-2032F
- Historical Data and Forecast of Slovenia Salicylic Acid Market Revenues & Volume By Others for the Period 2022-2032F
- Slovenia Salicylic Acid Import Export Trade Statistics
- Market Opportunity Assessment By Application
- Slovenia Salicylic Acid Top Companies Market Share
- Slovenia Salicylic Acid Competitive Benchmarking By Technical and Operational Parameters
- Slovenia Salicylic Acid Company Profiles
- Slovenia Salicylic Acid Key Strategic Recommendations
Frequently Asked Questions About the Market Study (FAQs):
6Wresearch actively monitors the Slovenia Salicylic Acid Market and publishes its comprehensive annual report, highlighting emerging trends, growth drivers, revenue analysis, and forecast outlook. Our insights help businesses to make data-backed strategic decisions with ongoing market dynamics. Our analysts track relevent industries related to the Slovenia Salicylic Acid Market, allowing our clients with actionable intelligence and reliable forecasts tailored to emerging regional needs.
Yes, we provide customisation as per your requirements. To learn more, feel free to contact us on sales@6wresearch.com
1 Executive Summary |
2 Introduction |
2.1 Key Highlights of the Report |
2.2 Report Description |
2.3 Market Scope & Segmentation |
2.4 Research Methodology |
2.5 Assumptions |
3 Slovenia Salicylic Acid Market Overview |
3.1 Slovenia Country Macro Economic Indicators |
3.2 Slovenia Salicylic Acid Market Revenues & Volume, 2022 & 2032F |
3.3 Slovenia Salicylic Acid Market - Industry Life Cycle |
3.4 Slovenia Salicylic Acid Market - Porter's Five Forces |
3.5 Slovenia Salicylic Acid Market Revenues & Volume Share, By Application, 2022 & 2032F |
4 Slovenia Salicylic Acid Market Dynamics |
4.1 Impact Analysis |
4.2 Market Drivers |
4.2.1 Growing awareness about skincare and personal care products |
4.2.2 Increasing demand for pharmaceuticals and cosmetics industry |
4.2.3 Rise in disposable income of consumers |
4.3 Market Restraints |
4.3.1 Stringent regulations and standards for product approval |
4.3.2 Availability of alternatives such as natural skincare ingredients |
5 Slovenia Salicylic Acid Market Trends |
6 Slovenia Salicylic Acid Market Segmentations |
6.1 Slovenia Salicylic Acid Market, By Application |
6.1.1 Overview and Analysis |
6.1.2 Slovenia Salicylic Acid Market Revenues & Volume, By Pharmaceutical, 2022-2032F |
6.1.3 Slovenia Salicylic Acid Market Revenues & Volume, By Food & Preservatives, 2022-2032F |
6.1.4 Slovenia Salicylic Acid Market Revenues & Volume, By Cosmetics, 2022-2032F |
6.1.5 Slovenia Salicylic Acid Market Revenues & Volume, By Others, 2022-2032F |
7 Slovenia Salicylic Acid Market Import-Export Trade Statistics |
7.1 Slovenia Salicylic Acid Market Export to Major Countries |
7.2 Slovenia Salicylic Acid Market Imports from Major Countries |
8 Slovenia Salicylic Acid Market Key Performance Indicators |
8.1 Number of new product launches containing salicylic acid |
8.2 Percentage increase in RD investments in skincare and pharmaceutical industries |
8.3 Growth in the number of skincare clinics and beauty spas offering salicylic acid treatments |
9 Slovenia Salicylic Acid Market - Opportunity Assessment |
9.1 Slovenia Salicylic Acid Market Opportunity Assessment, By Application, 2022 & 2032F |
10 Slovenia Salicylic Acid Market - Competitive Landscape |
10.1 Slovenia Salicylic Acid Market Revenue Share, By Companies, 2025 |
10.2 Slovenia Salicylic Acid Market Competitive Benchmarking, By Operating and Technical Parameters |
11 Company Profiles |
12 Recommendations | 13 Disclaimer |
Export potential assessment - trade Analytics for 2030
Export potential enables firms to identify high-growth global markets with greater confidence by combining advanced trade intelligence with a structured quantitative methodology. The framework analyzes emerging demand trends and country-level import patterns while integrating macroeconomic and trade datasets such as GDP and population forecasts, bilateral import–export flows, tariff structures, elasticity differentials between developed and developing economies, geographic distance, and import demand projections. Using weighted trade values from 2020–2024 as the base period to project country-to-country export potential for 2030, these inputs are operationalized through calculated drivers such as gravity model parameters, tariff impact factors, and projected GDP per-capita growth. Through an analysis of hidden potentials, demand hotspots, and market conditions that are most favorable to success, this method enables firms to focus on target countries, maximize returns, and global expansion with data, backed by accuracy.
By factoring in the projected importer demand gap that is currently unmet and could be potential opportunity, it identifies the potential for the Exporter (Country) among 190 countries, against the general trade analysis, which identifies the biggest importer or exporter.
To discover high-growth global markets and optimize your business strategy:
Click Here
Pricing
- Single User License$ 1,995
- Department License$ 2,400
- Site License$ 3,120
- Global License$ 3,795

Search
Thought Leadership and Analyst Meet


Our Clients
Latest Reports
- Canada Cloud CFD Market (2026-2032) | Size & Revenue, Industry, Growth, Competitive Landscape, Forecast, Segmentation, Value, Outlook, Trends, Share, Analysis, Companies
- Taiwan Food Delivery Platform Market (2026-2032) | Companies, Outlook, Analysis, Trends, Value, Revenue, Segmentation, Share, Forecast, Competitive Landscape, Growth, Size & Forecast
- United Kingdom (UK) Long-term Care Insurance Market (2026-2032) | Growth, Share, Consumer Insights, Drivers, Opportunities, Competition, Pricing Analysis, Segments, Restraints, Companies, Competitive, Value, Outlook, Size, Demand, Analysis, Challenges, Strategic Insights, Investment Trends, Revenue, Trends, Supply, Forecast
- United Kingdom (UK) Long Term Care Market (2026-2032) | Companies, Outlook, Analysis, Trends, Value, Revenue, Segmentation, Share, Forecast, Competitive Landscape, Growth, Size & Forecast
- Iraq Insulation and Waterproofing Market (2026-2032) | Outlook, Drivers, Growth, Size, Share, Industry, Revenue, Trends, Demand, Competitive, Strategic Insights, Opportunities, Segments, Companies, Challenges, Strategy, Consumer Insights, Analysis, Investment Trends, Value, Segmentation, Forecast, Restraints
- India Switchgear Market Outlook (2026-2032) | Size, Share, Trends, Growth, Revenue, Forecast, Analysis, Value, Outlook
- Pakistan Contraceptive Implants Market (2025-2031) | Demand, Growth, Size, Share, Industry, Pricing Analysis, Competitive, Strategic Insights, Strategy, Consumer Insights, Analysis, Investment Trends, Opportunities, Revenue, Segments, Value, Segmentation, Supply, Forecast, Restraints, Outlook, Competition, Drivers, Trends, Companies, Challenges
- Sri Lanka Packaging Market (2026-2032) | Outlook, Competition, Drivers, Trends, Demand, Pricing Analysis, Competitive, Strategic Insights, Companies, Challenges, Strategy, Consumer Insights, Analysis, Investment Trends, Opportunities, Growth, Size, Share, Industry, Revenue, Segments, Value, Segmentation, Supply, Forecast, Restraints
- India Kids Watches Market (2026-2032) | Strategy, Consumer Insights, Analysis, Investment Trends, Opportunities, Growth, Size, Share, Industry, Revenue, Segments, Value, Segmentation, Supply, Forecast, Restraints, Outlook, Competition, Drivers, Trends, Demand, Pricing Analysis, Competitive, Strategic Insights, Companies, Challenges
- Saudi Arabia Core Assurance Service Market (2025-2031) | Strategy, Consumer Insights, Analysis, Investment Trends, Opportunities, Growth, Size, Share, Industry, Revenue, Segments, Value, Segmentation, Supply, Forecast, Restraints, Outlook, Competition, Drivers, Trends, Demand, Pricing Analysis, Competitive, Strategic Insights, Companies, Challenges
Industry Events and Analyst Meet

India EV Show 2026

EV tech India Expo 2026

Auto Tech Asia 2026

Battery Tech India 2026

Smart Production Solutions Guangzhou 2026
Whitepaper
- Middle East & Africa Commercial Security Market Click here to view more.
- Middle East & Africa Fire Safety Systems & Equipment Market Click here to view more.
- GCC Drone Market Click here to view more.
- Middle East Lighting Fixture Market Click here to view more.
- GCC Physical & Perimeter Security Market Click here to view more.
6WResearch In News
- Doha a strategic location for EV manufacturing hub: IPA Qatar
- Demand for luxury TVs surging in the GCC, says Samsung
- Empowering Growth: The Thriving Journey of Bangladesh’s Cable Industry
- Demand for luxury TVs surging in the GCC, says Samsung
- Video call with a traditional healer? Once unthinkable, it’s now common in South Africa
- Intelligent Buildings To Smooth GCC’s Path To Net Zero