Slovenia Smart TV Market (2026-2032) | Outlook, Revenue, Companies, Size, Trends, Forecast, Analysis, Segmentation, Share, Value, Industry & Growth
Market Forecast By Screen Type (28 to 40 inch, 41 to 59 inch, 60 inch & above), By Panel Type (LED, OLED, QLED, Others), By Resolution Type (HD TV, Full HD TV, 4K UHD TV, 8K TV), By Distribution Channel (Direct, Indirect), By End Use (Commercial, Residential, Others) And Competitive Landscape
| Product Code: ETC4796081 | Publication Date: Nov 2023 | Updated Date: Feb 2026 | Product Type: Market Research Report | |
| Publisher: 6Wresearch | Author: Shubham Padhi | No. of Pages: 60 | No. of Figures: 30 | No. of Tables: 5 |
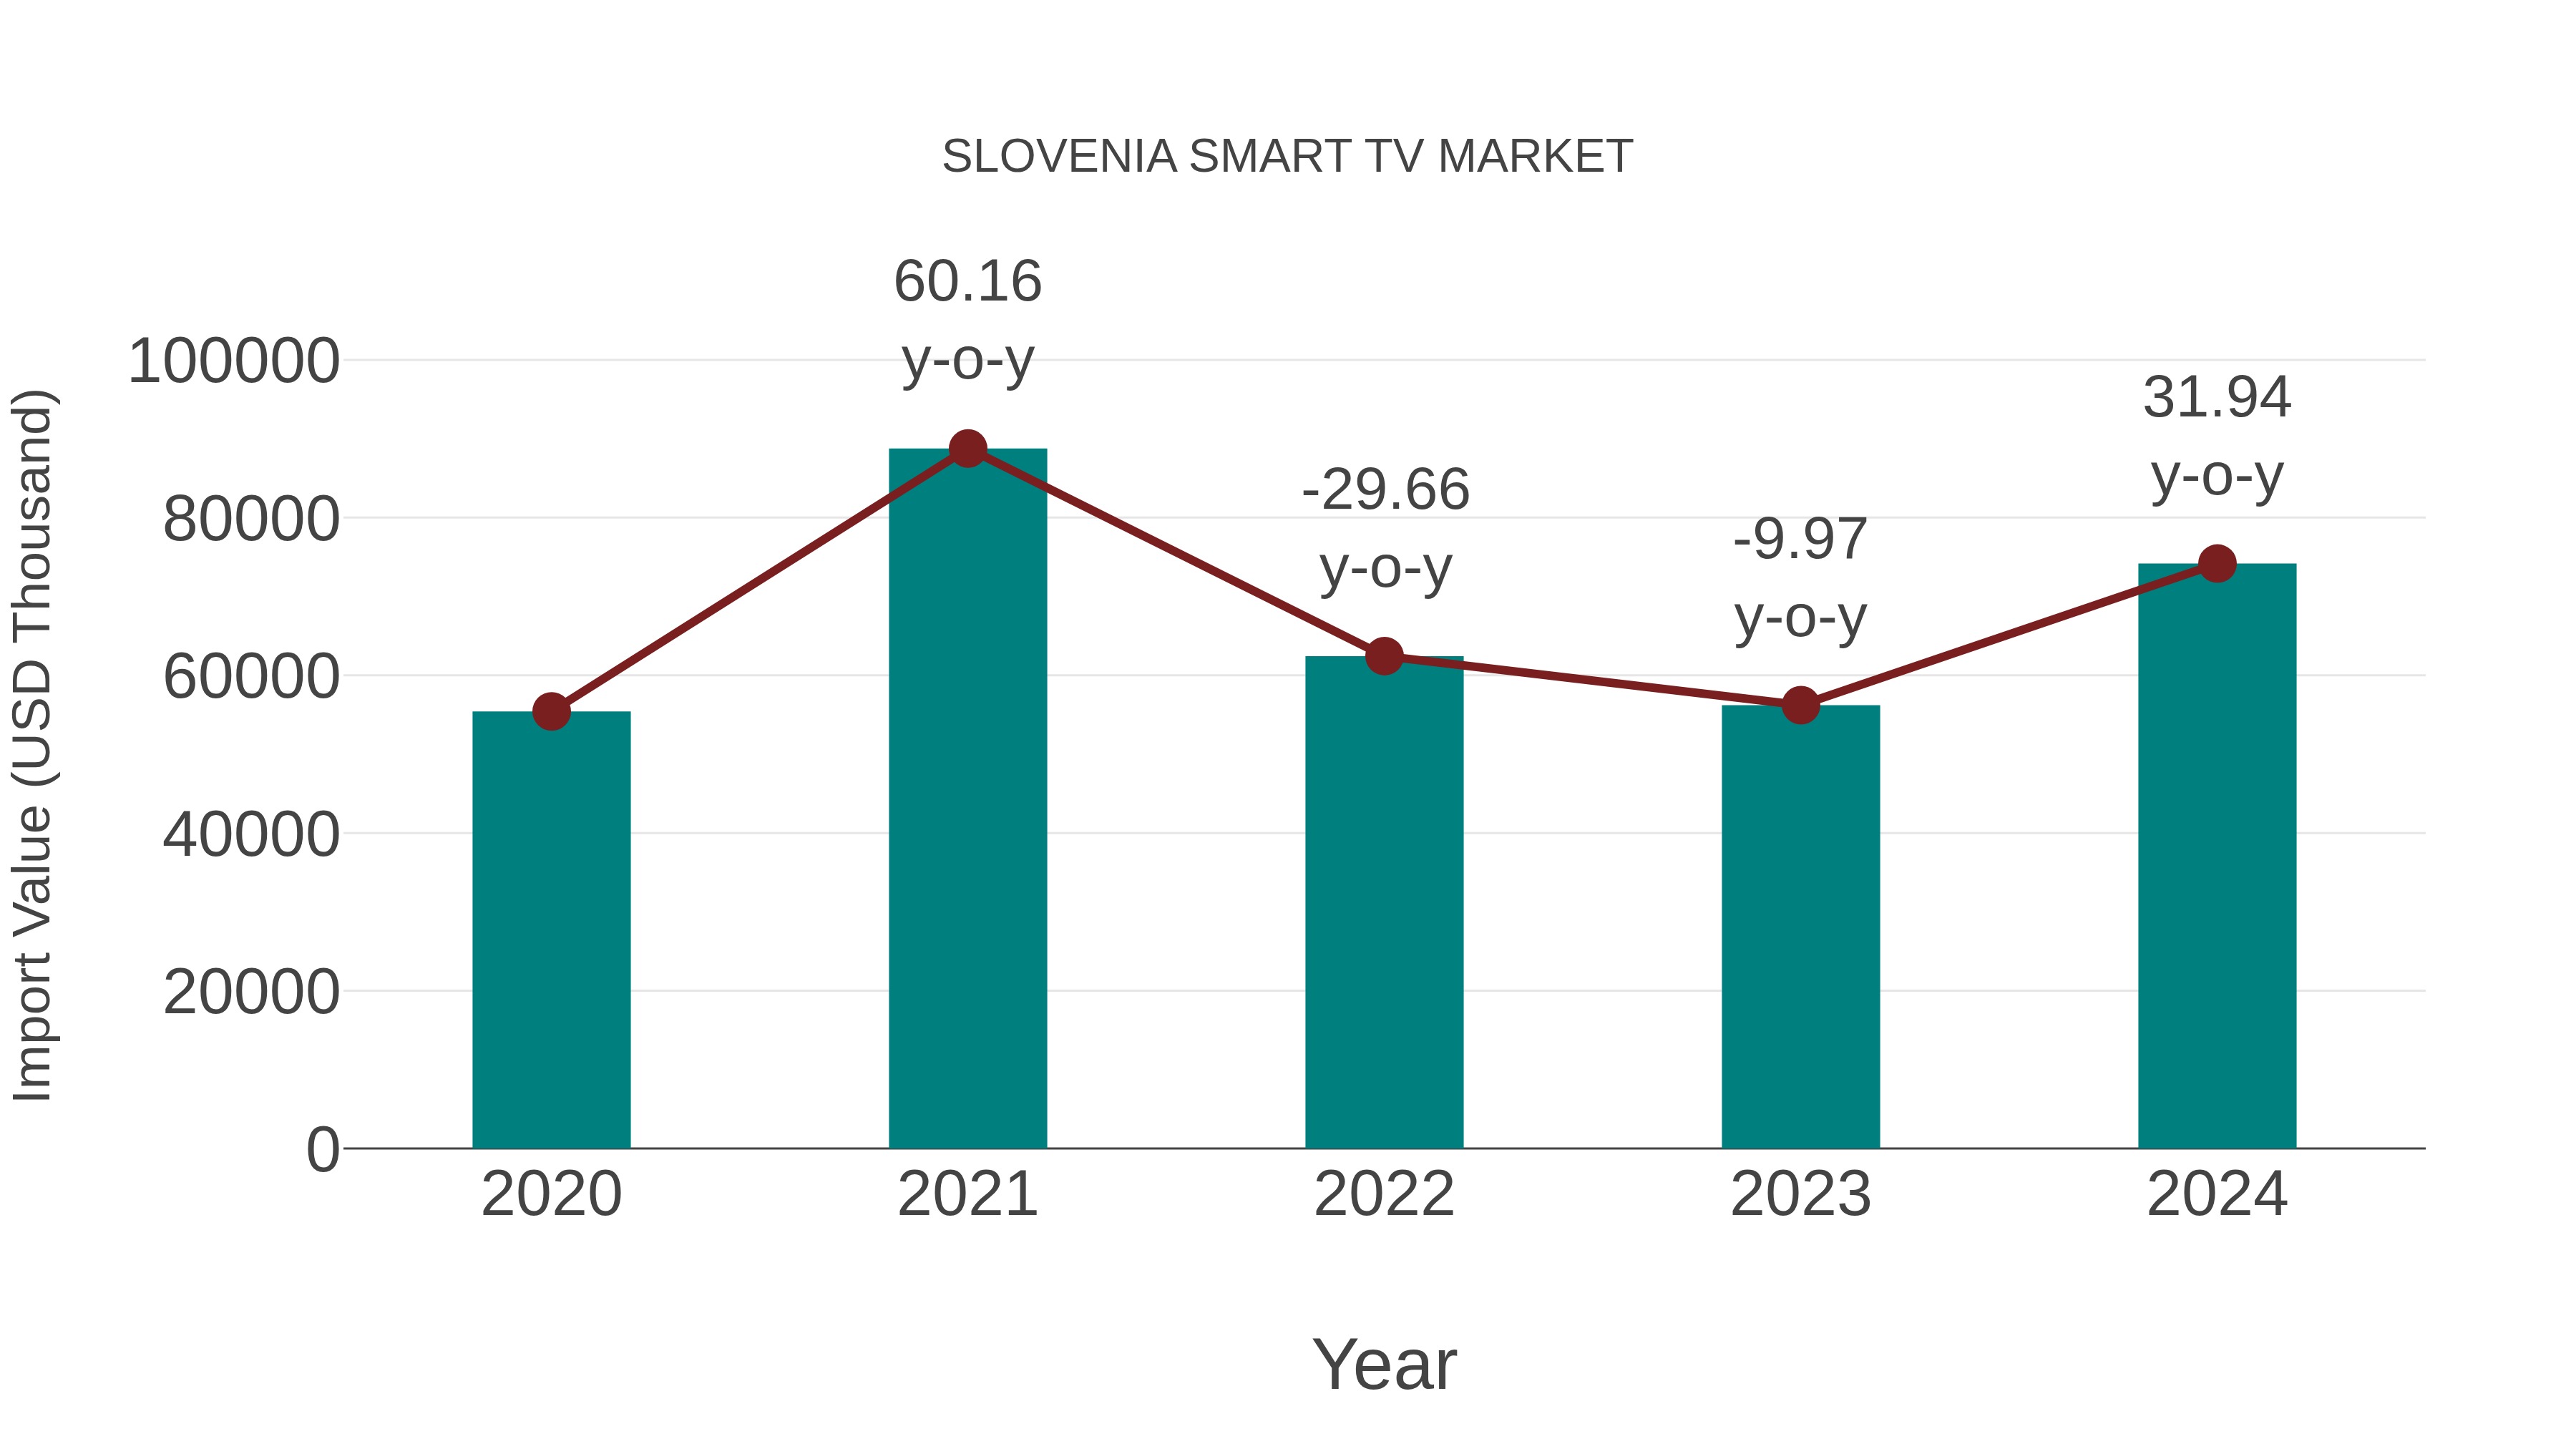
Slovenia Smart Tv Market: Import Trend Analysis
Slovenia import trend in the smart TV market exhibited significant growth from 2023 to 2024, with a notable increase of 31.94%. The compound annual growth rate (CAGR) for the period 2020-2024 stood at 7.56%. This surge in imports could be attributed to a rising demand for advanced technology products in the region, indicating a positive market momentum and consumer preference for smart TV offerings.
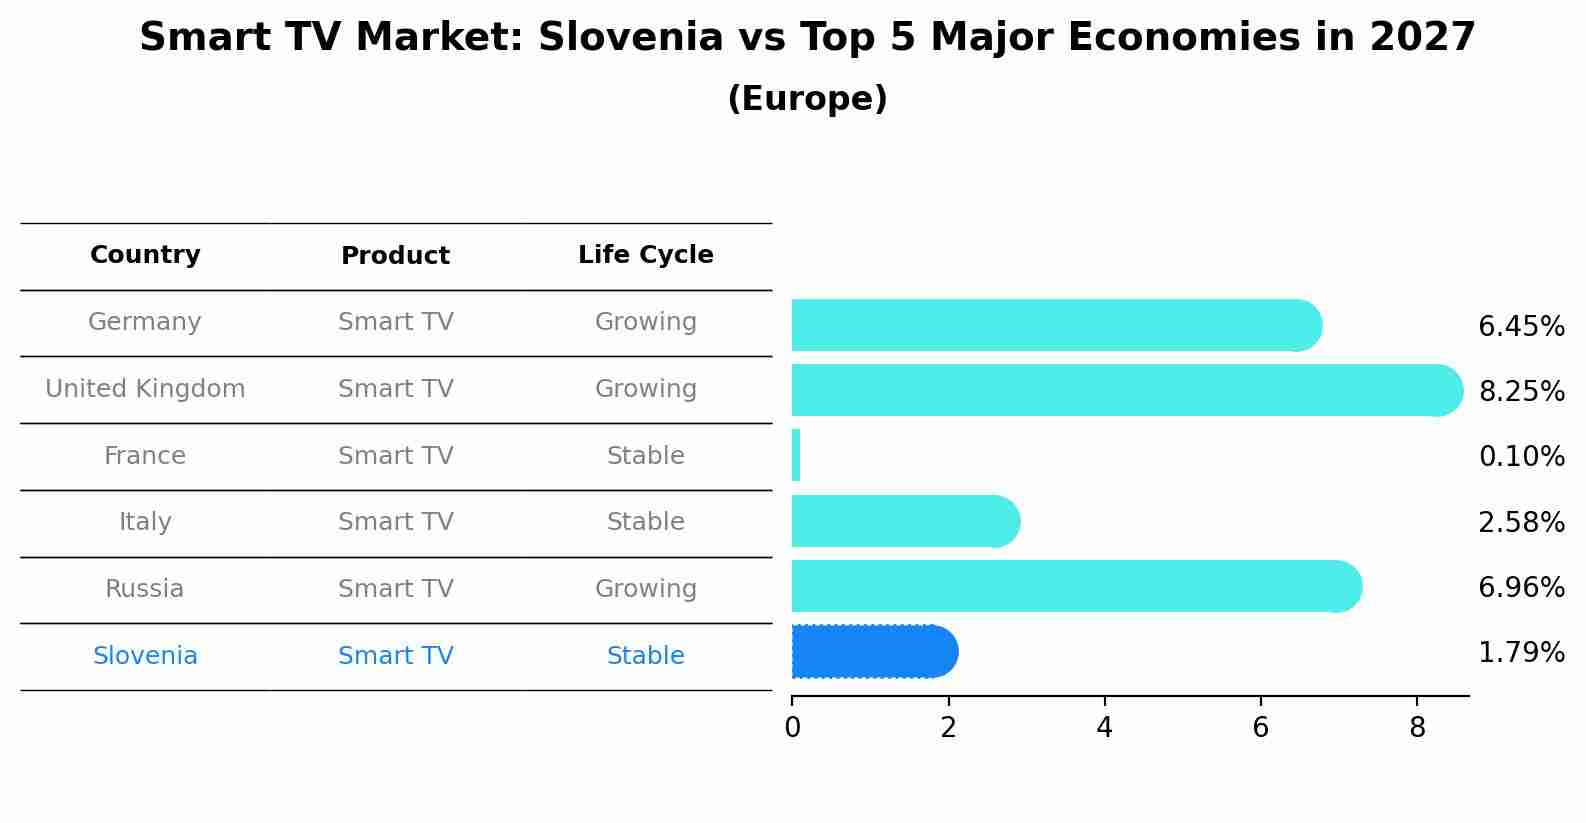
Smart TV Market: Slovenia vs Top 5 Major Economies in 2027 (Europe)
By 2027, Slovenia's Smart TV market is forecasted to achieve a stable growth rate of 1.79%, with Germany leading the Europe region, followed by United Kingdom, France, Italy and Russia.
Key Highlights of the Report:
- Slovenia Smart TV Market Outlook
- Market Size of Slovenia Smart TV Market, 2025
- Forecast of Slovenia Smart TV Market, 2032
- Historical Data and Forecast of Slovenia Smart TV Revenues & Volume for the Period 2022-2032F
- Slovenia Smart TV Market Trend Evolution
- Slovenia Smart TV Market Drivers and Challenges
- Slovenia Smart TV Price Trends
- Slovenia Smart TV Porter`s Five Forces
- Slovenia Smart TV Industry Life Cycle
- Historical Data and Forecast of Slovenia Smart TV Market Revenues & Volume By Screen Type for the Period 2022-2032F
- Historical Data and Forecast of Slovenia Smart TV Market Revenues & Volume By 28 to 40 inch for the Period 2022-2032F
- Historical Data and Forecast of Slovenia Smart TV Market Revenues & Volume By 41 to 59 inch for the Period 2022-2032F
- Historical Data and Forecast of Slovenia Smart TV Market Revenues & Volume By 60 inch & above for the Period 2022-2032F
- Historical Data and Forecast of Slovenia Smart TV Market Revenues & Volume By Panel Type for the Period 2022-2032F
- Historical Data and Forecast of Slovenia Smart TV Market Revenues & Volume By LED for the Period 2022-2032F
- Historical Data and Forecast of Slovenia Smart TV Market Revenues & Volume By OLED for the Period 2022-2032F
- Historical Data and Forecast of Slovenia Smart TV Market Revenues & Volume By QLED for the Period 2022-2032F
- Historical Data and Forecast of Slovenia Smart TV Market Revenues & Volume By Others for the Period 2022-2032F
- Historical Data and Forecast of Slovenia Smart TV Market Revenues & Volume By Resolution Type for the Period 2022-2032F
- Historical Data and Forecast of Slovenia Smart TV Market Revenues & Volume By HD TV for the Period 2022-2032F
- Historical Data and Forecast of Slovenia Smart TV Market Revenues & Volume By Full HD TV for the Period 2022-2032F
- Historical Data and Forecast of Slovenia Smart TV Market Revenues & Volume By 4K UHD TV for the Period 2022-2032F
- Historical Data and Forecast of Slovenia Smart TV Market Revenues & Volume By 8K TV for the Period 2022-2032F
- Historical Data and Forecast of Slovenia Smart TV Market Revenues & Volume By Distribution Channel for the Period 2022-2032F
- Historical Data and Forecast of Slovenia Smart TV Market Revenues & Volume By Direct for the Period 2022-2032F
- Historical Data and Forecast of Slovenia Smart TV Market Revenues & Volume By Indirect for the Period 2022-2032F
- Historical Data and Forecast of Slovenia Smart TV Market Revenues & Volume By End Use for the Period 2022-2032F
- Historical Data and Forecast of Slovenia Smart TV Market Revenues & Volume By Commercial for the Period 2022-2032F
- Historical Data and Forecast of Slovenia Smart TV Market Revenues & Volume By Residential for the Period 2022-2032F
- Historical Data and Forecast of Slovenia Smart TV Market Revenues & Volume By Others for the Period 2022-2032F
- Slovenia Smart TV Import Export Trade Statistics
- Market Opportunity Assessment By Screen Type
- Market Opportunity Assessment By Panel Type
- Market Opportunity Assessment By Resolution Type
- Market Opportunity Assessment By Distribution Channel
- Market Opportunity Assessment By End Use
- Slovenia Smart TV Top Companies Market Share
- Slovenia Smart TV Competitive Benchmarking By Technical and Operational Parameters
- Slovenia Smart TV Company Profiles
- Slovenia Smart TV Key Strategic Recommendations
Frequently Asked Questions About the Market Study (FAQs):
6Wresearch actively monitors the Slovenia Smart TV Market and publishes its comprehensive annual report, highlighting emerging trends, growth drivers, revenue analysis, and forecast outlook. Our insights help businesses to make data-backed strategic decisions with ongoing market dynamics. Our analysts track relevent industries related to the Slovenia Smart TV Market, allowing our clients with actionable intelligence and reliable forecasts tailored to emerging regional needs.
Yes, we provide customisation as per your requirements. To learn more, feel free to contact us on sales@6wresearch.com
1 Executive Summary |
2 Introduction |
2.1 Key Highlights of the Report |
2.2 Report Description |
2.3 Market Scope & Segmentation |
2.4 Research Methodology |
2.5 Assumptions |
3 Slovenia Smart TV Market Overview |
3.1 Slovenia Country Macro Economic Indicators |
3.2 Slovenia Smart TV Market Revenues & Volume, 2022 & 2032F |
3.3 Slovenia Smart TV Market - Industry Life Cycle |
3.4 Slovenia Smart TV Market - Porter's Five Forces |
3.5 Slovenia Smart TV Market Revenues & Volume Share, By Screen Type, 2022 & 2032F |
3.6 Slovenia Smart TV Market Revenues & Volume Share, By Panel Type, 2022 & 2032F |
3.7 Slovenia Smart TV Market Revenues & Volume Share, By Resolution Type, 2022 & 2032F |
3.8 Slovenia Smart TV Market Revenues & Volume Share, By Distribution Channel, 2022 & 2032F |
3.9 Slovenia Smart TV Market Revenues & Volume Share, By ? End Use, 2022 & 2032F |
4 Slovenia Smart TV Market Dynamics |
4.1 Impact Analysis |
4.2 Market Drivers |
4.2.1 Increasing demand for high-quality content streaming services |
4.2.2 Technological advancements in smart TV features and functionalities |
4.2.3 Growing consumer preference for interactive and connected entertainment experiences |
4.3 Market Restraints |
4.3.1 High initial cost of smart TVs compared to traditional TVs |
4.3.2 Limited availability of high-speed internet in some regions impacting smart TV usage |
4.3.3 Concerns regarding data privacy and security with smart TV devices |
5 Slovenia Smart TV Market Trends |
6 Slovenia Smart TV Market Segmentations |
6.1 Slovenia Smart TV Market, By Screen Type |
6.1.1 Overview and Analysis |
6.1.2 Slovenia Smart TV Market Revenues & Volume, By 28 to 40 inch, 2022-2032F |
6.1.3 Slovenia Smart TV Market Revenues & Volume, By 41 to 59 inch, 2022-2032F |
6.1.4 Slovenia Smart TV Market Revenues & Volume, By 60 inch & above, 2022-2032F |
6.2 Slovenia Smart TV Market, By Panel Type |
6.2.1 Overview and Analysis |
6.2.2 Slovenia Smart TV Market Revenues & Volume, By LED, 2022-2032F |
6.2.3 Slovenia Smart TV Market Revenues & Volume, By OLED, 2022-2032F |
6.2.4 Slovenia Smart TV Market Revenues & Volume, By QLED, 2022-2032F |
6.2.5 Slovenia Smart TV Market Revenues & Volume, By Others, 2022-2032F |
6.3 Slovenia Smart TV Market, By Resolution Type |
6.3.1 Overview and Analysis |
6.3.2 Slovenia Smart TV Market Revenues & Volume, By HD TV, 2022-2032F |
6.3.3 Slovenia Smart TV Market Revenues & Volume, By Full HD TV, 2022-2032F |
6.3.4 Slovenia Smart TV Market Revenues & Volume, By 4K UHD TV, 2022-2032F |
6.3.5 Slovenia Smart TV Market Revenues & Volume, By 8K TV, 2022-2032F |
6.4 Slovenia Smart TV Market, By Distribution Channel |
6.4.1 Overview and Analysis |
6.4.2 Slovenia Smart TV Market Revenues & Volume, By Direct, 2022-2032F |
6.4.3 Slovenia Smart TV Market Revenues & Volume, By Indirect, 2022-2032F |
6.5 Slovenia Smart TV Market, By ? End Use |
6.5.1 Overview and Analysis |
6.5.2 Slovenia Smart TV Market Revenues & Volume, By Commercial, 2022-2032F |
6.5.3 Slovenia Smart TV Market Revenues & Volume, By Residential, 2022-2032F |
6.5.4 Slovenia Smart TV Market Revenues & Volume, By Others, 2022-2032F |
7 Slovenia Smart TV Market Import-Export Trade Statistics |
7.1 Slovenia Smart TV Market Export to Major Countries |
7.2 Slovenia Smart TV Market Imports from Major Countries |
8 Slovenia Smart TV Market Key Performance Indicators |
8.1 Average time spent on smart TV apps per user |
8.2 Percentage of households with access to high-speed internet |
8.3 Adoption rate of smart TV features and functionalities among consumers |
9 Slovenia Smart TV Market - Opportunity Assessment |
9.1 Slovenia Smart TV Market Opportunity Assessment, By Screen Type, 2022 & 2032F |
9.2 Slovenia Smart TV Market Opportunity Assessment, By Panel Type, 2022 & 2032F |
9.3 Slovenia Smart TV Market Opportunity Assessment, By Resolution Type, 2022 & 2032F |
9.4 Slovenia Smart TV Market Opportunity Assessment, By Distribution Channel, 2022 & 2032F |
9.5 Slovenia Smart TV Market Opportunity Assessment, By ? End Use, 2022 & 2032F |
10 Slovenia Smart TV Market - Competitive Landscape |
10.1 Slovenia Smart TV Market Revenue Share, By Companies, 2025 |
10.2 Slovenia Smart TV Market Competitive Benchmarking, By Operating and Technical Parameters |
11 Company Profiles |
12 Recommendations | 13 Disclaimer |
Global Go To Market Strategy - 2030
Export potential enables firms to identify high-growth global markets with greater confidence by combining advanced trade intelligence with a structured quantitative methodology. The framework analyzes emerging demand trends and country-level import patterns while integrating macroeconomic and trade datasets such as GDP and population forecasts, bilateral import–export flows, tariff structures, elasticity differentials between developed and developing economies, geographic distance, and import demand projections. Using weighted trade values from 2020–2024 as the base period to project country-to-country export potential for 2030, these inputs are operationalized through calculated drivers such as gravity model parameters, tariff impact factors, and projected GDP per-capita growth. Through an analysis of hidden potentials, demand hotspots, and market conditions that are most favorable to success, this method enables firms to focus on target countries, maximize returns, and global expansion with data, backed by accuracy.
By factoring in the projected importer demand gap that is currently unmet and could be potential opportunity, it identifies the potential for the Exporter (Country) among 190 countries, against the general trade analysis, which identifies the biggest importer or exporter.
To discover high-growth global markets and optimize your business strategy:
Click Here
Pricing
- Single User License$ 1,995
- Department License$ 2,400
- Site License$ 3,120
- Global License$ 3,795

Leadership Perspectives from Industry Events
Search
Thought Leadership and Analyst Meet


Our Clients
6WResearch In News
- India Air Conditioner Market Set for Strong Rebound in 2026 After Weather-Led Correction and GST-Driven Recovery: 6Wresearch
- ADAS in India: How Automatic Emergency Braking, Blind Spot Detection & Driver Monitoring are Transforming Road Safety
- Doha a strategic location for EV manufacturing hub: IPA Qatar
- Demand for luxury TVs surging in the GCC, says Samsung
- Empowering Growth: The Thriving Journey of Bangladesh’s Cable Industry
- Demand for luxury TVs surging in the GCC, says Samsung
Latest Reports
- Poland Fire Protection Systems Market (2026-2032)
- Cape Verde Portable Hand-Thrown Extinguisher Market (2026-2032)
- Canada Portable Hand-Thrown Extinguisher Market (2026-2032)
- Cameroon Portable Hand-Thrown Extinguisher Market (2026-2032)
- Burundi Portable Hand-Thrown Extinguisher Market (2026-2032)
- Burkina Faso Portable Hand-Thrown Extinguisher Market (2026-2032)
- Bulgaria Portable Hand-Thrown Extinguisher Market (2026-2032)
- Brunei Portable Hand-Thrown Extinguisher Market (2026-2032)
- Botswana Portable Hand-Thrown Extinguisher Market (2026-2032)
- Bosnia and Herzegovina Portable Hand-Thrown Extinguisher Market (2026-2032)
Industry Events and Analyst Meet

HIMTEX 2026

India Refining Summit 2026

India EV Show 2026

EV tech India Expo 2026

Auto Tech Asia 2026
Whitepaper
- Middle East & Africa Commercial Security Market Click here to view more.
- Middle East & Africa Fire Safety Systems & Equipment Market Click here to view more.
- GCC Drone Market Click here to view more.
- Middle East Lighting Fixture Market Click here to view more.
- GCC Physical & Perimeter Security Market Click here to view more.