South Africa Rice Husk Ash Market | Analysis, Growth, Value, COVID-19 IMPACT, Companies, Size, Industry, Forecast, Revenue, Share & Trends
Market Forecast By Silica Content (80-84%, 85-89%, 90-94%, Greater Than 95%), By Silica Extraction Process (Alkaline Extraction, Precipitated Silica Extraction, Mesoporous Silica Extraction, Sol-Gel Method), By Application (Building and Construction, Steel Industry, Ceramics and Refractory, Rubber, Others) And Competitive Landscape
| Product Code: ETC178747 | Publication Date: Jan 2022 | Updated Date: Sep 2025 | Product Type: Market Research Report | |
| Publisher: 6Wresearch | Author: Dhaval Chaurasia | No. of Pages: 70 | No. of Figures: 35 | No. of Tables: 5 |
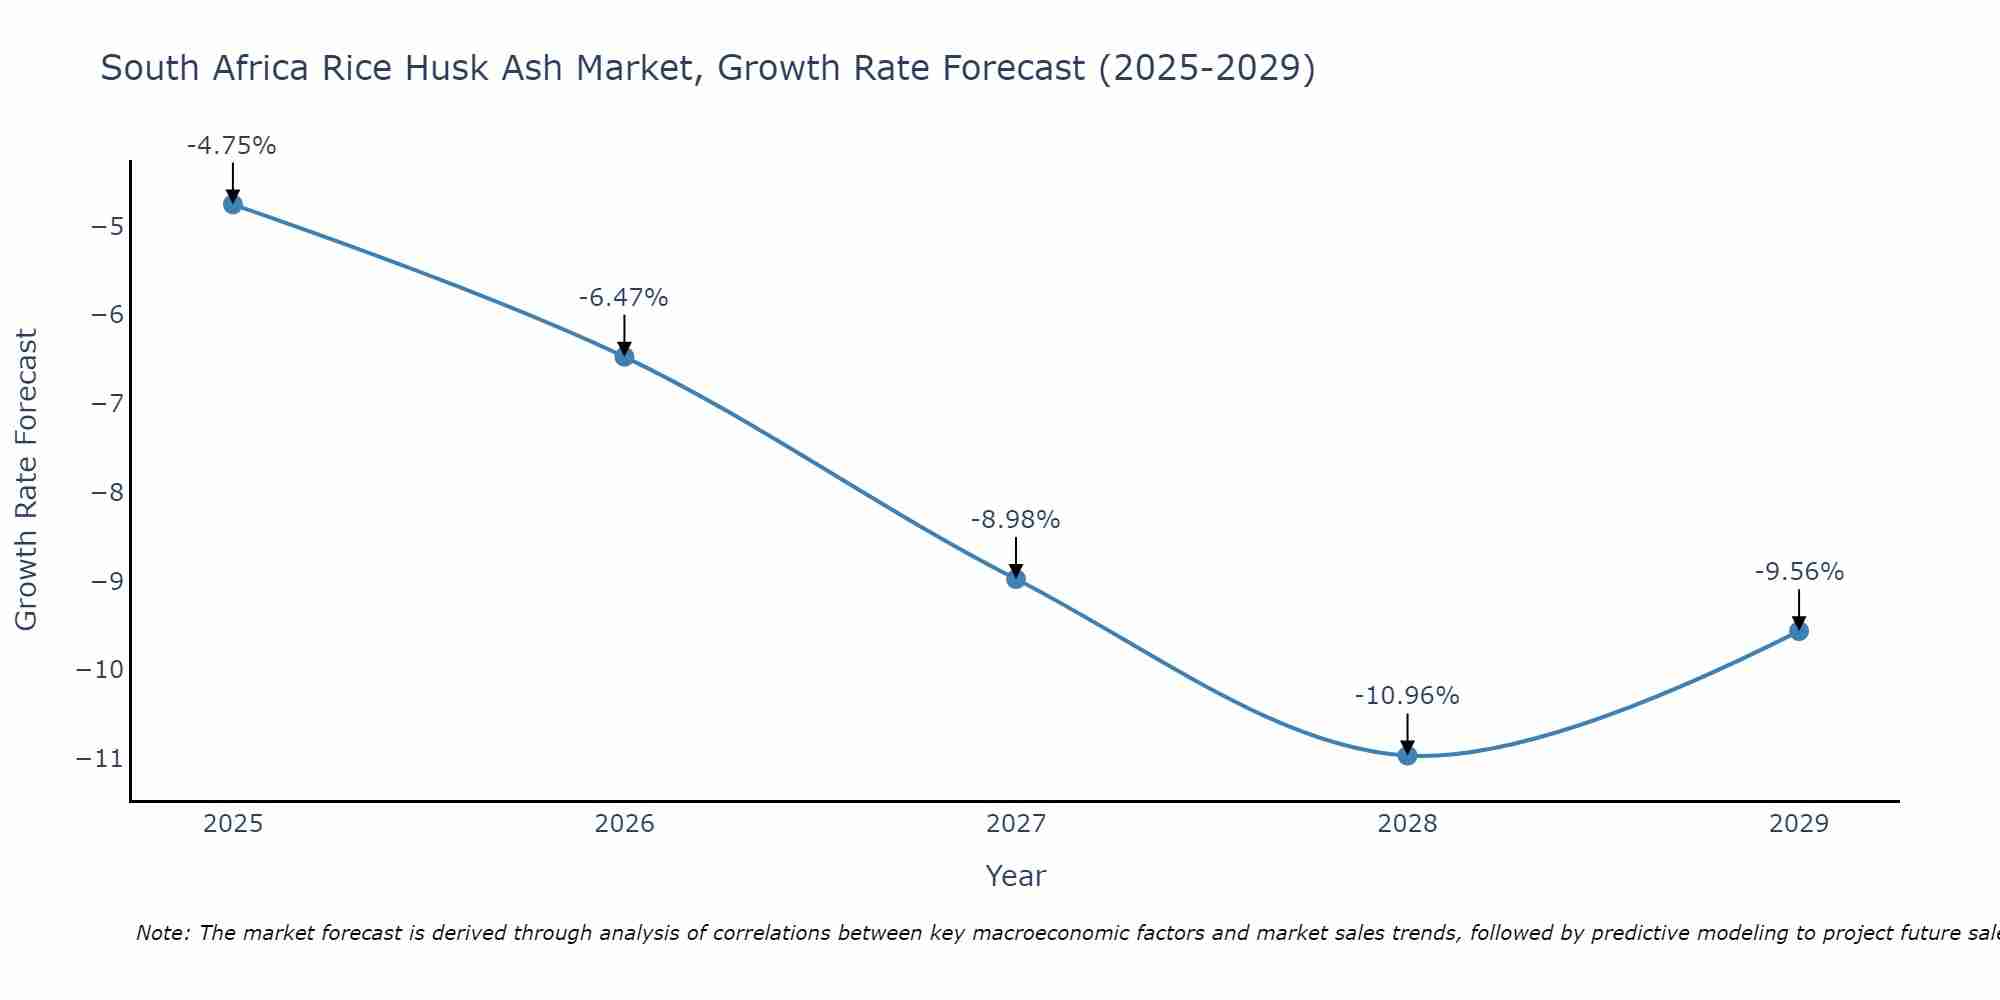
South Africa Rice Husk Ash Market Size Growth Rate
The South Africa Rice Husk Ash Market is projected to witness mixed growth rate patterns during 2025 to 2029. Although the growth rate starts strong at -4.75% in 2025, it steadily loses momentum, ending at -9.56% by 2029.
South Africa Rice Husk Ash Market Overview
The South Africa Rice Husk Ash market is witnessing steady growth driven by its increasing adoption as a sustainable alternative in various industries. Rice husk ash, a byproduct of rice milling, is gaining popularity for its applications in construction, agriculture, and manufacturing sectors due to its eco-friendly and cost-effective nature. The market is propelled by the growing awareness about the benefits of using rice husk ash, such as its high silica content, which enhances the strength and durability of concrete, and its potential to improve soil fertility. Key players in the South Africa Rice Husk Ash market are focusing on product innovation and expanding their distribution networks to cater to the rising demand from diverse end-user industries. The market is poised for further expansion as more industries recognize the value of incorporating sustainable practices into their operations.
South Africa Rice Husk Ash Market Trends
The South Africa Rice Husk Ash market is experiencing a growing demand due to its various applications in industries such as construction, agriculture, and energy production. The increasing focus on sustainable and eco-friendly materials has boosted the adoption of rice husk ash as a replacement for traditional construction materials like cement. In agriculture, rice husk ash is being used as a soil amendment to improve soil fertility and crop yields. Furthermore, the energy sector is utilizing rice husk ash as a renewable energy source. The market is also witnessing a rise in research and development activities to explore new applications and enhance the quality of rice husk ash products. Overall, the South Africa Rice Husk Ash market is poised for significant growth in the coming years.
South Africa Rice Husk Ash Market Challenges
In the South Africa Rice Husk Ash Market, some of the key challenges include limited awareness and understanding of the benefits of using rice husk ash as a sustainable alternative in various industries. Another challenge is the lack of standardized quality control measures and certification processes, leading to variations in product quality and reliability. Additionally, the availability and consistency of rice husk ash supply can be a challenge due to factors such as seasonal fluctuations in rice production and transportation logistics. Furthermore, competition from other industrial byproducts and alternative materials also poses a challenge in establishing a strong market presence for rice husk ash products in South Africa. Overcoming these challenges will require increased education and promotion efforts, as well as collaborations between stakeholders to enhance quality standards and streamline supply chains.
South Africa Rice Husk Ash Market Investment Opportunities
In the South Africa Rice Husk Ash Market, there are various investment opportunities available due to the increasing demand for sustainable and eco-friendly products in construction, agriculture, and waste management sectors. Investors can consider opportunities in the production and supply chain of rice husk ash as a potential raw material for industries such as cement production, soil amendment, and wastewater treatment. Additionally, investing in research and development for innovative applications of rice husk ash in the South African market could lead to new revenue streams and market differentiation. Partnering with local rice mills and agricultural cooperatives to secure a consistent supply of raw materials can also be a strategic investment approach in this growing market.
South Africa Rice Husk Ash Market Government Policy
The South African government has implemented policies to promote the sustainable use of rice husk ash in various industries, particularly in construction and agriculture. These policies focus on incentivizing the development and adoption of technologies that utilize rice husk ash, such as in concrete production to reduce carbon emissions and enhance material durability. Additionally, the government has introduced regulations to ensure the safe handling and disposal of rice husk ash to mitigate environmental impacts. Overall, the government`s policies aim to support the growth of the South Africa rice husk ash market by fostering innovation, sustainability, and responsible waste management practices across different sectors.
South Africa Rice Husk Ash Market Future Outlook
The South Africa rice husk ash market is expected to witness significant growth in the coming years due to the increasing demand for sustainable construction materials. Rice husk ash is being increasingly utilized as a pozzolanic material in the production of high-performance concrete, which is gaining popularity in the construction industry for its enhanced durability and strength. The government`s initiatives to promote sustainable building practices and the growing awareness among consumers regarding the environmental benefits of using rice husk ash are expected to drive the market growth further. Additionally, the rising focus on reducing carbon emissions and the need for innovative construction materials are likely to create lucrative opportunities for market players in the South Africa rice husk ash market.
Key Highlights of the Report:
- South Africa Rice Husk Ash Market Outlook
- Market Size of South Africa Rice Husk Ash Market, 2021
- Forecast of South Africa Rice Husk Ash Market, 2031
- Historical Data and Forecast of South Africa Rice Husk Ash Revenues & Volume for the Period 2018 - 2031
- South Africa Rice Husk Ash Market Trend Evolution
- South Africa Rice Husk Ash Market Drivers and Challenges
- South Africa Rice Husk Ash Price Trends
- South Africa Rice Husk Ash Porter's Five Forces
- South Africa Rice Husk Ash Industry Life Cycle
- Historical Data and Forecast of South Africa Rice Husk Ash Market Revenues & Volume By Silica Content for the Period 2018 - 2031
- Historical Data and Forecast of South Africa Rice Husk Ash Market Revenues & Volume By 80-84% for the Period 2018 - 2031
- Historical Data and Forecast of South Africa Rice Husk Ash Market Revenues & Volume By 85-89% for the Period 2018 - 2031
- Historical Data and Forecast of South Africa Rice Husk Ash Market Revenues & Volume By 90-94% for the Period 2018 - 2031
- Historical Data and Forecast of South Africa Rice Husk Ash Market Revenues & Volume By Greater Than 95% for the Period 2018 - 2031
- Historical Data and Forecast of South Africa Rice Husk Ash Market Revenues & Volume By Silica Extraction Process for the Period 2018 - 2031
- Historical Data and Forecast of South Africa Rice Husk Ash Market Revenues & Volume By Alkaline Extraction for the Period 2018 - 2031
- Historical Data and Forecast of South Africa Rice Husk Ash Market Revenues & Volume By Precipitated Silica Extraction for the Period 2018 - 2031
- Historical Data and Forecast of South Africa Rice Husk Ash Market Revenues & Volume By Mesoporous Silica Extraction for the Period 2018 - 2031
- Historical Data and Forecast of South Africa Rice Husk Ash Market Revenues & Volume By Sol-Gel Method for the Period 2018 - 2031
- Historical Data and Forecast of South Africa Rice Husk Ash Market Revenues & Volume By Application for the Period 2018 - 2031
- Historical Data and Forecast of South Africa Rice Husk Ash Market Revenues & Volume By Building and Construction for the Period 2018 - 2031
- Historical Data and Forecast of South Africa Rice Husk Ash Market Revenues & Volume By Steel Industry for the Period 2018 - 2031
- Historical Data and Forecast of South Africa Rice Husk Ash Market Revenues & Volume By Ceramics and Refractory for the Period 2018 - 2031
- Historical Data and Forecast of South Africa Rice Husk Ash Market Revenues & Volume By Rubber for the Period 2018 - 2031
- Historical Data and Forecast of South Africa Rice Husk Ash Market Revenues & Volume By Others for the Period 2018 - 2031
- South Africa Rice Husk Ash Import Export Trade Statistics
- Market Opportunity Assessment By Silica Content
- Market Opportunity Assessment By Silica Extraction Process
- Market Opportunity Assessment By Application
- South Africa Rice Husk Ash Top Companies Market Share
- South Africa Rice Husk Ash Competitive Benchmarking By Technical and Operational Parameters
- South Africa Rice Husk Ash Company Profiles
- South Africa Rice Husk Ash Key Strategic Recommendations
Frequently Asked Questions About the Market Study (FAQs):
6Wresearch actively monitors the South Africa Rice Husk Ash Market and publishes its comprehensive annual report, highlighting emerging trends, growth drivers, revenue analysis, and forecast outlook. Our insights help businesses to make data-backed strategic decisions with ongoing market dynamics. Our analysts track relevent industries related to the South Africa Rice Husk Ash Market, allowing our clients with actionable intelligence and reliable forecasts tailored to emerging regional needs.
Yes, we provide customisation as per your requirements. To learn more, feel free to contact us on sales@6wresearch.com
1 Executive Summary |
2 Introduction |
2.1 Key Highlights of the Report |
2.2 Report Description |
2.3 Market Scope & Segmentation |
2.4 Research Methodology |
2.5 Assumptions |
3 South Africa Rice Husk Ash Market Overview |
3.1 South Africa Country Macro Economic Indicators |
3.2 South Africa Rice Husk Ash Market Revenues & Volume, 2021 & 2031F |
3.3 South Africa Rice Husk Ash Market - Industry Life Cycle |
3.4 South Africa Rice Husk Ash Market - Porter's Five Forces |
3.5 South Africa Rice Husk Ash Market Revenues & Volume Share, By Silica Content, 2021 & 2031F |
3.6 South Africa Rice Husk Ash Market Revenues & Volume Share, By Silica Extraction Process, 2021 & 2031F |
3.7 South Africa Rice Husk Ash Market Revenues & Volume Share, By Application, 2021 & 2031F |
4 South Africa Rice Husk Ash Market Dynamics |
4.1 Impact Analysis |
4.2 Market Drivers |
4.2.1 Increasing awareness about the benefits of using rice husk ash as a sustainable alternative in various industries. |
4.2.2 Growing demand for eco-friendly construction materials in South Africa. |
4.2.3 Government initiatives promoting the use of rice husk ash in different applications. |
4.3 Market Restraints |
4.3.1 Limited availability of rice husk ash due to fluctuations in rice production. |
4.3.2 Lack of standardized quality control measures for rice husk ash. |
4.3.3 Challenges in logistics and transportation of rice husk ash to end-users. |
5 South Africa Rice Husk Ash Market Trends |
6 South Africa Rice Husk Ash Market, By Types |
6.1 South Africa Rice Husk Ash Market, By Silica Content |
6.1.1 Overview and Analysis |
6.1.2 South Africa Rice Husk Ash Market Revenues & Volume, By Silica Content, 2021-2031F |
6.1.3 South Africa Rice Husk Ash Market Revenues & Volume, By 80-84%, 2021-2031F |
6.1.4 South Africa Rice Husk Ash Market Revenues & Volume, By 85-89%, 2021-2031F |
6.1.5 South Africa Rice Husk Ash Market Revenues & Volume, By 90-94%, 2021-2031F |
6.1.6 South Africa Rice Husk Ash Market Revenues & Volume, By Greater Than 95%, 2021-2031F |
6.2 South Africa Rice Husk Ash Market, By Silica Extraction Process |
6.2.1 Overview and Analysis |
6.2.2 South Africa Rice Husk Ash Market Revenues & Volume, By Alkaline Extraction, 2021-2031F |
6.2.3 South Africa Rice Husk Ash Market Revenues & Volume, By Precipitated Silica Extraction, 2021-2031F |
6.2.4 South Africa Rice Husk Ash Market Revenues & Volume, By Mesoporous Silica Extraction, 2021-2031F |
6.2.5 South Africa Rice Husk Ash Market Revenues & Volume, By Sol-Gel Method, 2021-2031F |
6.3 South Africa Rice Husk Ash Market, By Application |
6.3.1 Overview and Analysis |
6.3.2 South Africa Rice Husk Ash Market Revenues & Volume, By Building and Construction, 2021-2031F |
6.3.3 South Africa Rice Husk Ash Market Revenues & Volume, By Steel Industry, 2021-2031F |
6.3.4 South Africa Rice Husk Ash Market Revenues & Volume, By Ceramics and Refractory, 2021-2031F |
6.3.5 South Africa Rice Husk Ash Market Revenues & Volume, By Rubber, 2021-2031F |
6.3.6 South Africa Rice Husk Ash Market Revenues & Volume, By Others, 2021-2031F |
7 South Africa Rice Husk Ash Market Import-Export Trade Statistics |
7.1 South Africa Rice Husk Ash Market Export to Major Countries |
7.2 South Africa Rice Husk Ash Market Imports from Major Countries |
8 South Africa Rice Husk Ash Market Key Performance Indicators |
8.1 Percentage increase in the adoption of rice husk ash in construction projects. |
8.2 Number of research studies or publications highlighting the benefits of rice husk ash. |
8.3 Percentage of companies incorporating rice husk ash in their manufacturing processes. |
8.4 Improvement in the efficiency of rice husk ash production methods. |
9 South Africa Rice Husk Ash Market - Opportunity Assessment |
9.1 South Africa Rice Husk Ash Market Opportunity Assessment, By Silica Content, 2021 & 2031F |
9.2 South Africa Rice Husk Ash Market Opportunity Assessment, By Silica Extraction Process, 2021 & 2031F |
9.3 South Africa Rice Husk Ash Market Opportunity Assessment, By Application, 2021 & 2031F |
10 South Africa Rice Husk Ash Market - Competitive Landscape |
10.1 South Africa Rice Husk Ash Market Revenue Share, By Companies, 2021 |
10.2 South Africa Rice Husk Ash Market Competitive Benchmarking, By Operating and Technical Parameters |
11 Company Profiles |
12 Recommendations |
13 Disclaimer |
Global Go To Market Strategy - 2030
Export potential enables firms to identify high-growth global markets with greater confidence by combining advanced trade intelligence with a structured quantitative methodology. The framework analyzes emerging demand trends and country-level import patterns while integrating macroeconomic and trade datasets such as GDP and population forecasts, bilateral import–export flows, tariff structures, elasticity differentials between developed and developing economies, geographic distance, and import demand projections. Using weighted trade values from 2020–2024 as the base period to project country-to-country export potential for 2030, these inputs are operationalized through calculated drivers such as gravity model parameters, tariff impact factors, and projected GDP per-capita growth. Through an analysis of hidden potentials, demand hotspots, and market conditions that are most favorable to success, this method enables firms to focus on target countries, maximize returns, and global expansion with data, backed by accuracy.
By factoring in the projected importer demand gap that is currently unmet and could be potential opportunity, it identifies the potential for the Exporter (Country) among 190 countries, against the general trade analysis, which identifies the biggest importer or exporter.
To discover high-growth global markets and optimize your business strategy:
Click Here
Pricing
- Single User License$ 1,995
- Department License$ 2,400
- Site License$ 3,120
- Global License$ 3,795

Leadership Perspectives from Industry Events
Search
Thought Leadership and Analyst Meet


Our Clients
6WResearch In News
- India Air Conditioner Market Set for Strong Rebound in 2026 After Weather-Led Correction and GST-Driven Recovery: 6Wresearch
- ADAS in India: How Automatic Emergency Braking, Blind Spot Detection & Driver Monitoring are Transforming Road Safety
- Doha a strategic location for EV manufacturing hub: IPA Qatar
- Demand for luxury TVs surging in the GCC, says Samsung
- Empowering Growth: The Thriving Journey of Bangladesh’s Cable Industry
- Demand for luxury TVs surging in the GCC, says Samsung
Latest Reports
- Nicaragua RPG Gaming Market (2026-2032)
- New Zealand RPG Gaming Market (2026-2032)
- Netherlands RPG Gaming Market (2026-2032)
- Nauru RPG Gaming Market (2026-2032)
- Namibia RPG Gaming Market (2026-2032)
- Mozambique RPG Gaming Market (2026-2032)
- Montenegro RPG Gaming Market (2026-2032)
- Mongolia RPG Gaming Market (2026-2032)
- Monaco RPG Gaming Market (2026-2032)
- Micronesia RPG Gaming Market (2026-2032)
Industry Events and Analyst Meet

HIMTEX 2026

India Refining Summit 2026

India EV Show 2026

EV tech India Expo 2026

Auto Tech Asia 2026
Whitepaper
- Middle East & Africa Commercial Security Market Click here to view more.
- Middle East & Africa Fire Safety Systems & Equipment Market Click here to view more.
- GCC Drone Market Click here to view more.
- Middle East Lighting Fixture Market Click here to view more.
- GCC Physical & Perimeter Security Market Click here to view more.