Tanzania Connectors Market (2025-2031) | Forecast, Value, Companies, Revenue, COVID-19 IMPACT, Size, Trends, Growth, Analysis, Share, Industry & Outlook
Market Forecast By Product Type (PCB (Printed circuit board) Connectors, Rectangular I/O, Application Specific Connectors, Fiber Optic Connectors, RF (Radio Frequency) Coax, Circular Connectors, IC (Integrated circuit) Sockets, Others), By End-user (Transportation, Consumer Electronics, Computer and Peripherals, Industrial, Telecom/Datacom, Others) And Competitive Landscape
| Product Code: ETC026895 | Publication Date: Oct 2020 | Updated Date: Apr 2025 | Product Type: Report | |
| Publisher: 6Wresearch | Author: Ravi Bhandari | No. of Pages: 70 | No. of Figures: 35 | No. of Tables: 5 |
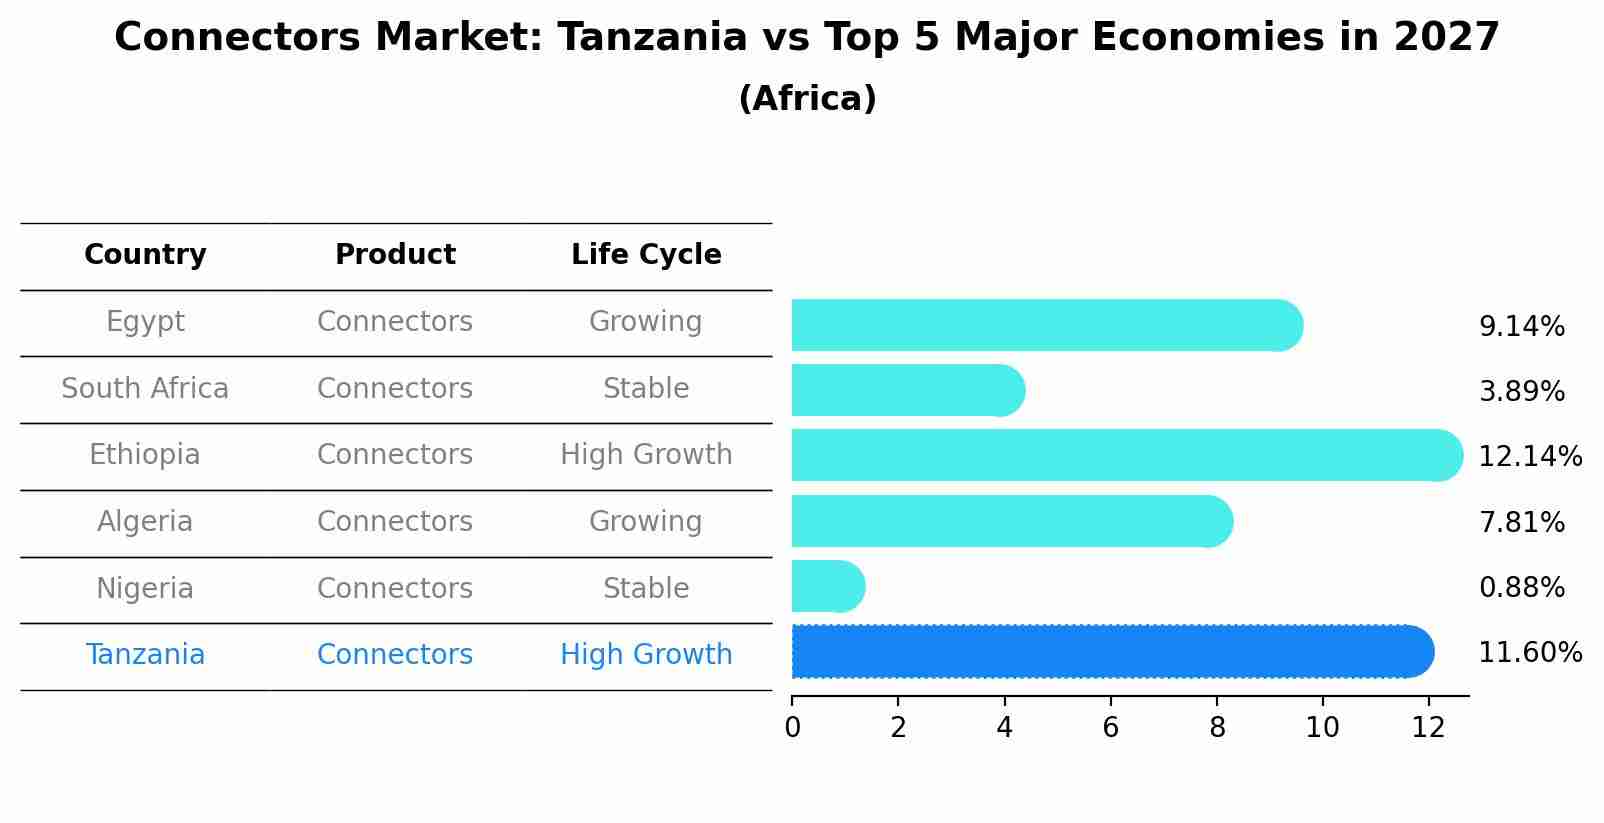
Connectors Market: Tanzania vs Top 5 Major Economies in 2027 (Africa)
By 2027, Tanzania's Connectors market is forecasted to achieve a high growth rate of 11.60%, with Egypt leading the Africa region, followed by South Africa, Ethiopia, Algeria and Nigeria.
Tanzania Connectors Market Overview
The Tanzania Connector Market encompasses a wide range of electronic connectors used in various industries including automotive, telecommunications, consumer electronics, and industrial machinery. Growth is driven by increasing demand for reliable connectivity solutions, miniaturization trends, and advancements in 5G technology. Key players focus on innovation to meet evolving industry standards and consumer expectations.
Drivers of the market
The Tanzania Connector Market is fueled by the expanding telecommunications, automotive, and consumer electronics sectors. Connectors are essential components for ensuring seamless connectivity in electronic devices and infrastructure. Key drivers include increasing demand for high-speed data transmission, proliferation of smart devices requiring reliable connectivity solutions, and technological advancements in connector design improving performance and durability.
Challenges of the market
In the Tanzania Connector Market, one significant challenge is the dependency on imports for high-quality connectors, which can lead to supply chain vulnerabilities and increased costs. Local manufacturing capabilities are often limited, and the quality of domestically produced connectors may not meet international standards. Additionally, the market faces competition from cheaper, lower-quality products that flood the market, making it difficult for quality manufacturers to compete on price. Ensuring proper installation and maintenance also requires skilled technicians, which can be a scarce resource.
Government Policy of the market
The connector market in Tanzania is expanding due to the growing demand in various sectors, including automotive, telecommunications, and electronics. Government initiatives aimed at improving the countrys industrial capabilities and infrastructure development are key drivers. Policies that encourage foreign investment and technological innovation help in attracting global connector manufacturers to set up operations in Tanzania. Additionally, efforts to enhance the countrys digital infrastructure, such as expanding broadband connectivity, further stimulate the demand for connectors.
Key Highlights of the Report:
- Tanzania Connectors Market Outlook
- Market Size of Tanzania Connectors Market, 2024
- Forecast of Tanzania Connectors Market, 2031
- Historical Data and Forecast of Tanzania Connectors Revenues & Volume for the Period 2021-2031
- Tanzania Connectors Market Trend Evolution
- Tanzania Connectors Market Drivers and Challenges
- Tanzania Connectors Price Trends
- Tanzania Connectors Porter's Five Forces
- Tanzania Connectors Industry Life Cycle
- Historical Data and Forecast of Tanzania Connectors Market Revenues & Volume By Product Type for the Period 2021-2031
- Historical Data and Forecast of Tanzania Connectors Market Revenues & Volume By PCB (Printed circuit board) Connectors for the Period 2021-2031
- Historical Data and Forecast of Tanzania Connectors Market Revenues & Volume By Rectangular I/O for the Period 2021-2031
- Historical Data and Forecast of Tanzania Connectors Market Revenues & Volume By Application Specific Connectors for the Period 2021-2031
- Historical Data and Forecast of Tanzania Connectors Market Revenues & Volume By Fiber Optic Connectors for the Period 2021-2031
- Historical Data and Forecast of Tanzania Connectors Market Revenues & Volume By RF (Radio Frequency) Coax for the Period 2021-2031
- Historical Data and Forecast of Tanzania Connectors Market Revenues & Volume By Circular Connectors for the Period 2021-2031
- Historical Data and Forecast of Tanzania Connectors Market Revenues & Volume By IC (Integrated circuit) Sockets for the Period 2021-2031
- Historical Data and Forecast of Tanzania PCB (Printed circuit board) Connectors Connectors Market Revenues & Volume By Others for the Period 2021-2031
- Historical Data and Forecast of Tanzania Connectors Market Revenues & Volume By End-user for the Period 2021-2031
- Historical Data and Forecast of Tanzania Connectors Market Revenues & Volume By Transportation for the Period 2021-2031
- Historical Data and Forecast of Tanzania Connectors Market Revenues & Volume By Consumer Electronics for the Period 2021-2031
- Historical Data and Forecast of Tanzania Connectors Market Revenues & Volume By Computer and Peripherals for the Period 2021-2031
- Historical Data and Forecast of Tanzania Connectors Market Revenues & Volume By Industrial for the Period 2021-2031
- Historical Data and Forecast of Tanzania Connectors Market Revenues & Volume By Telecom/Datacom for the Period 2021-2031
- Historical Data and Forecast of Tanzania Connectors Market Revenues & Volume By Others for the Period 2021-2031
- Tanzania Connectors Import Export Trade Statistics
- Market Opportunity Assessment By Product Type
- Market Opportunity Assessment By End-user
- Tanzania Connectors Top Companies Market Share
- Tanzania Connectors Competitive Benchmarking By Technical and Operational Parameters
- Tanzania Connectors Company Profiles
- Tanzania Connectors Key Strategic Recommendations
Frequently Asked Questions About the Market Study (FAQs):
6Wresearch actively monitors the Tanzania Connectors Market and publishes its comprehensive annual report, highlighting emerging trends, growth drivers, revenue analysis, and forecast outlook. Our insights help businesses to make data-backed strategic decisions with ongoing market dynamics. Our analysts track relevent industries related to the Tanzania Connectors Market, allowing our clients with actionable intelligence and reliable forecasts tailored to emerging regional needs.
Yes, we provide customisation as per your requirements. To learn more, feel free to contact us on sales@6wresearch.com
1 Executive Summary |
2 Introduction |
2.1 Key Highlights of the Report |
2.2 Report Description |
2.3 Market Scope & Segmentation |
2.4 Research Methodology |
2.5 Assumptions |
3 Tanzania Connectors Market Overview |
3.1 Tanzania Country Macro Economic Indicators |
3.2 Tanzania Connectors Market Revenues & Volume, 2021 & 2031F |
3.3 Tanzania Connectors Market - Industry Life Cycle |
3.4 Tanzania Connectors Market - Porter's Five Forces |
3.5 Tanzania Connectors Market Revenues & Volume Share, By Product Type, 2021 & 2031F |
3.6 Tanzania Connectors Market Revenues & Volume Share, By End-user, 2021 & 2031F |
4 Tanzania Connectors Market Dynamics |
4.1 Impact Analysis |
4.2 Market Drivers |
4.3 Market Restraints |
5 Tanzania Connectors Market Trends |
6 Tanzania Connectors Market, By Types |
6.1 Tanzania Connectors Market, By Product Type |
6.1.1 Overview and Analysis |
6.1.2 Tanzania Connectors Market Revenues & Volume, By Product Type, 2021-2031F |
6.1.3 Tanzania Connectors Market Revenues & Volume, By PCB (Printed circuit board) Connectors, 2021-2031F |
6.1.4 Tanzania Connectors Market Revenues & Volume, By Rectangular I/O, 2021-2031F |
6.1.5 Tanzania Connectors Market Revenues & Volume, By Application Specific Connectors, 2021-2031F |
6.1.6 Tanzania Connectors Market Revenues & Volume, By Fiber Optic Connectors, 2021-2031F |
6.1.7 Tanzania Connectors Market Revenues & Volume, By RF (Radio Frequency) Coax, 2021-2031F |
6.1.8 Tanzania Connectors Market Revenues & Volume, By Circular Connectors, 2021-2031F |
6.1.9 Tanzania Connectors Market Revenues & Volume, By Others, 2021-2031F |
6.1.10 Tanzania Connectors Market Revenues & Volume, By Others, 2021-2031F |
6.2 Tanzania Connectors Market, By End-user |
6.2.1 Overview and Analysis |
6.2.2 Tanzania Connectors Market Revenues & Volume, By Transportation, 2021-2031F |
6.2.3 Tanzania Connectors Market Revenues & Volume, By Consumer Electronics, 2021-2031F |
6.2.4 Tanzania Connectors Market Revenues & Volume, By Computer and Peripherals, 2021-2031F |
6.2.5 Tanzania Connectors Market Revenues & Volume, By Industrial, 2021-2031F |
6.2.6 Tanzania Connectors Market Revenues & Volume, By Telecom/Datacom, 2021-2031F |
6.2.7 Tanzania Connectors Market Revenues & Volume, By Others, 2021-2031F |
7 Tanzania Connectors Market Import-Export Trade Statistics |
7.1 Tanzania Connectors Market Export to Major Countries |
7.2 Tanzania Connectors Market Imports from Major Countries |
8 Tanzania Connectors Market Key Performance Indicators |
9 Tanzania Connectors Market - Opportunity Assessment |
9.1 Tanzania Connectors Market Opportunity Assessment, By Product Type, 2021 & 2031F |
9.2 Tanzania Connectors Market Opportunity Assessment, By End-user, 2021 & 2031F |
10 Tanzania Connectors Market - Competitive Landscape |
10.1 Tanzania Connectors Market Revenue Share, By Companies, 2024 |
10.2 Tanzania Connectors Market Competitive Benchmarking, By Operating and Technical Parameters |
11 Company Profiles |
12 Recommendations |
13 Disclaimer |
Export potential assessment - trade Analytics for 2030
Export potential enables firms to identify high-growth global markets with greater confidence by combining advanced trade intelligence with a structured quantitative methodology. The framework analyzes emerging demand trends and country-level import patterns while integrating macroeconomic and trade datasets such as GDP and population forecasts, bilateral import–export flows, tariff structures, elasticity differentials between developed and developing economies, geographic distance, and import demand projections. Using weighted trade values from 2020–2024 as the base period to project country-to-country export potential for 2030, these inputs are operationalized through calculated drivers such as gravity model parameters, tariff impact factors, and projected GDP per-capita growth. Through an analysis of hidden potentials, demand hotspots, and market conditions that are most favorable to success, this method enables firms to focus on target countries, maximize returns, and global expansion with data, backed by accuracy.
By factoring in the projected importer demand gap that is currently unmet and could be potential opportunity, it identifies the potential for the Exporter (Country) among 190 countries, against the general trade analysis, which identifies the biggest importer or exporter.
To discover high-growth global markets and optimize your business strategy:
Click Here
Pricing
- Single User License$ 1,995
- Department License$ 2,400
- Site License$ 3,120
- Global License$ 3,795

Search
Thought Leadership and Analyst Meet


Our Clients
Latest Reports
- Canada Cloud CFD Market (2026-2032) | Size & Revenue, Industry, Growth, Competitive Landscape, Forecast, Segmentation, Value, Outlook, Trends, Share, Analysis, Companies
- Taiwan Food Delivery Platform Market (2026-2032) | Companies, Outlook, Analysis, Trends, Value, Revenue, Segmentation, Share, Forecast, Competitive Landscape, Growth, Size & Forecast
- United Kingdom (UK) Long-term Care Insurance Market (2026-2032) | Growth, Share, Consumer Insights, Drivers, Opportunities, Competition, Pricing Analysis, Segments, Restraints, Companies, Competitive, Value, Outlook, Size, Demand, Analysis, Challenges, Strategic Insights, Investment Trends, Revenue, Trends, Supply, Forecast
- United Kingdom (UK) Long Term Care Market (2026-2032) | Companies, Outlook, Analysis, Trends, Value, Revenue, Segmentation, Share, Forecast, Competitive Landscape, Growth, Size & Forecast
- Iraq Insulation and Waterproofing Market (2026-2032) | Outlook, Drivers, Growth, Size, Share, Industry, Revenue, Trends, Demand, Competitive, Strategic Insights, Opportunities, Segments, Companies, Challenges, Strategy, Consumer Insights, Analysis, Investment Trends, Value, Segmentation, Forecast, Restraints
- India Switchgear Market Outlook (2026-2032) | Size, Share, Trends, Growth, Revenue, Forecast, Analysis, Value, Outlook
- Pakistan Contraceptive Implants Market (2025-2031) | Demand, Growth, Size, Share, Industry, Pricing Analysis, Competitive, Strategic Insights, Strategy, Consumer Insights, Analysis, Investment Trends, Opportunities, Revenue, Segments, Value, Segmentation, Supply, Forecast, Restraints, Outlook, Competition, Drivers, Trends, Companies, Challenges
- Sri Lanka Packaging Market (2026-2032) | Outlook, Competition, Drivers, Trends, Demand, Pricing Analysis, Competitive, Strategic Insights, Companies, Challenges, Strategy, Consumer Insights, Analysis, Investment Trends, Opportunities, Growth, Size, Share, Industry, Revenue, Segments, Value, Segmentation, Supply, Forecast, Restraints
- India Kids Watches Market (2026-2032) | Strategy, Consumer Insights, Analysis, Investment Trends, Opportunities, Growth, Size, Share, Industry, Revenue, Segments, Value, Segmentation, Supply, Forecast, Restraints, Outlook, Competition, Drivers, Trends, Demand, Pricing Analysis, Competitive, Strategic Insights, Companies, Challenges
- Saudi Arabia Core Assurance Service Market (2025-2031) | Strategy, Consumer Insights, Analysis, Investment Trends, Opportunities, Growth, Size, Share, Industry, Revenue, Segments, Value, Segmentation, Supply, Forecast, Restraints, Outlook, Competition, Drivers, Trends, Demand, Pricing Analysis, Competitive, Strategic Insights, Companies, Challenges
Industry Events and Analyst Meet

India EV Show 2026

EV tech India Expo 2026

Auto Tech Asia 2026

Battery Tech India 2026

Smart Production Solutions Guangzhou 2026
Whitepaper
- Middle East & Africa Commercial Security Market Click here to view more.
- Middle East & Africa Fire Safety Systems & Equipment Market Click here to view more.
- GCC Drone Market Click here to view more.
- Middle East Lighting Fixture Market Click here to view more.
- GCC Physical & Perimeter Security Market Click here to view more.
6WResearch In News
- Doha a strategic location for EV manufacturing hub: IPA Qatar
- Demand for luxury TVs surging in the GCC, says Samsung
- Empowering Growth: The Thriving Journey of Bangladesh’s Cable Industry
- Demand for luxury TVs surging in the GCC, says Samsung
- Video call with a traditional healer? Once unthinkable, it’s now common in South Africa
- Intelligent Buildings To Smooth GCC’s Path To Net Zero