Tanzania Natural Polymers Market Outlook | COVID-19 IMPACT, Forecast, Trends, Industry, Value, Companies, Size, Share, Analysis, Growth & Revenue
Market Forecast By Product Type (Cellulose Ethers, Exudate And Vegetable Gums, Starch And Fermentation Products, Other Polymers), By Industry (Packaging Material, Medical & Cosmetics, Inks & Paints, Adhesives) And Competitive Landscape
| Product Code: ETC334555 | Publication Date: Aug 2022 | Updated Date: Aug 2025 | Product Type: Market Research Report | |
| Publisher: 6Wresearch | Author: Shubham Padhi | No. of Pages: 75 | No. of Figures: 35 | No. of Tables: 20 |
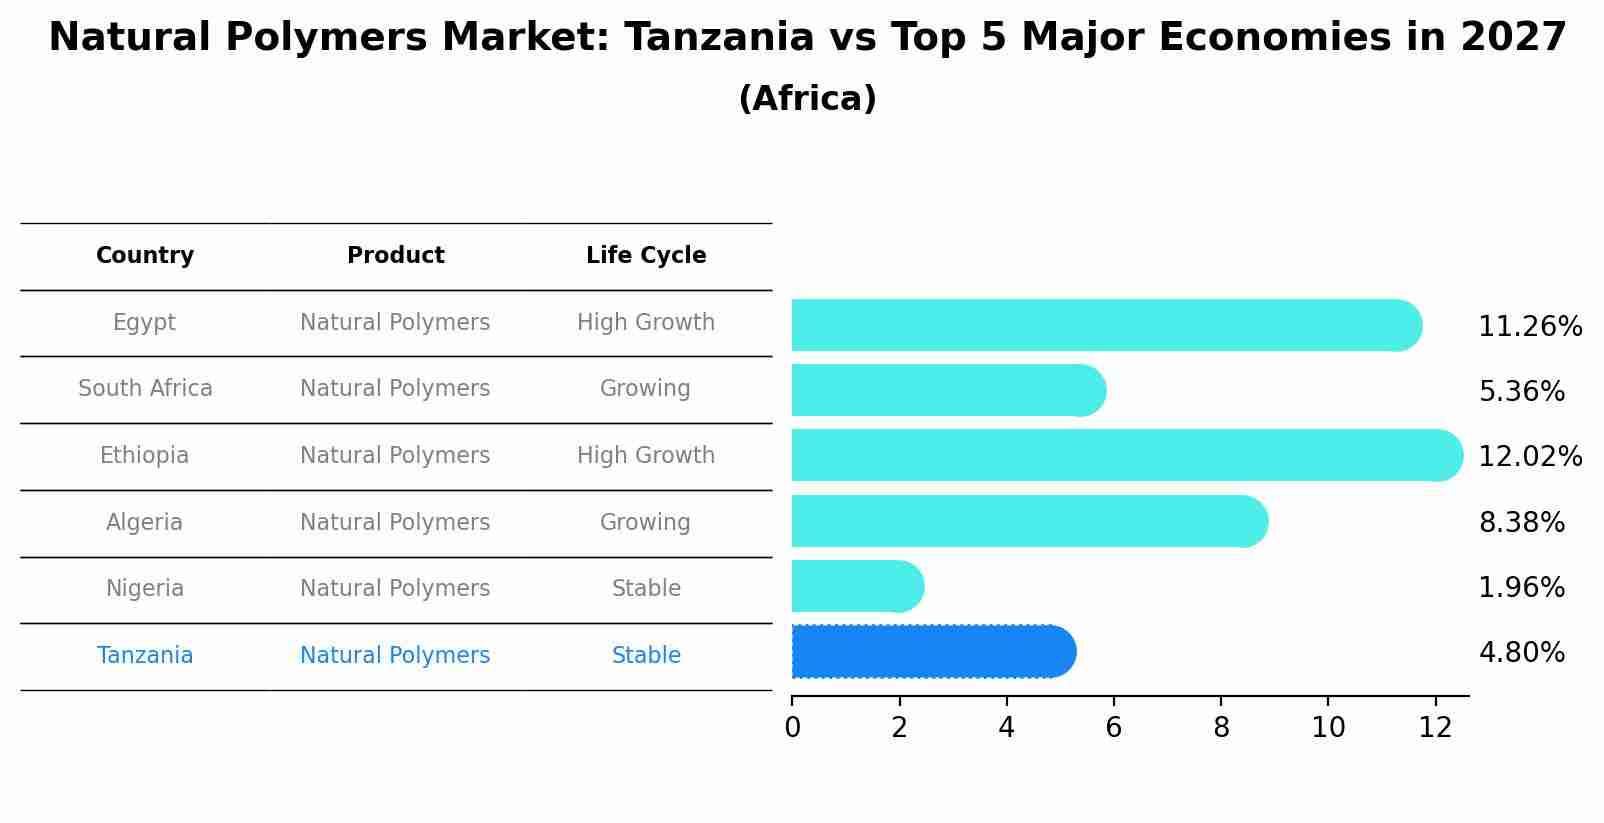
Natural Polymers Market: Tanzania vs Top 5 Major Economies in 2027 (Africa)
The Natural Polymers market in Tanzania is projected to grow at a stable growth rate of 4.80% by 2027, within the Africa region led by Egypt, along with other countries like South Africa, Ethiopia, Algeria and Nigeria, collectively shaping a dynamic and evolving market environment driven by innovation and increasing adoption of emerging technologies.
Tanzania Natural Polymers Market Synopsis
The Tanzania Natural Polymers Market is witnessing steady growth driven by increasing demand for eco-friendly and sustainable alternatives in various industries such as packaging, textiles, and cosmetics. Key natural polymers dominating the market include gum arabic, gelatin, and cellulose derivatives. Gum arabic is extensively used in food and beverage applications as a stabilizer and thickening agent, while gelatin finds wide use in pharmaceuticals and cosmetics for its binding and gelling properties. Cellulose derivatives are commonly used in the textile industry for their film-forming and adhesive properties. The market is characterized by the presence of both domestic and international players offering a wide range of natural polymers to cater to diverse industry requirements. Factors such as increasing awareness regarding environmental sustainability and government initiatives promoting the use of natural polymers are expected to drive further growth in the Tanzania Natural Polymers Market.
Tanzania Natural Polymers Market Trends
The Tanzania Natural Polymers Market is experiencing a growing demand for biodegradable and sustainable alternatives to synthetic polymers. Consumers are becoming more environmentally conscious, leading to an increased interest in natural polymers derived from sources such as cellulose, starch, and natural rubber. These natural polymers are being utilized in various industries, including packaging, textiles, and cosmetics, as they are renewable, biocompatible, and non-toxic. Additionally, the government`s initiatives to promote the use of eco-friendly materials further drive the market growth. Companies are focusing on research and development to innovate new applications and improve the properties of natural polymers, positioning Tanzania as a key player in the global natural polymers market.
Tanzania Natural Polymers Market Challenges
In the Tanzania Natural Polymers Market, several challenges are encountered. Limited awareness and understanding of the benefits of natural polymers among consumers and businesses hinder market growth. The lack of consistent quality standards and certification processes poses a challenge in ensuring product quality and reliability. Additionally, inadequate infrastructure and technology for extraction and processing of natural polymers restricts production capacity and efficiency. Limited research and development activities in the field also hinder innovation and the introduction of new products. Furthermore, competition from synthetic polymers, which are often cheaper and more readily available, presents a significant challenge in penetrating the market and gaining market share for natural polymer products in Tanzania.
Tanzania Natural Polymers Market Investment Opportunities
The Tanzania Natural Polymers Market presents promising investment opportunities in various sectors such as biodegradable packaging, cosmetics, pharmaceuticals, and food industries. With the increasing global demand for eco-friendly and sustainable products, natural polymers derived from sources like plant starch, cellulose, and proteins are gaining popularity. Investors can explore opportunities in the production and distribution of biodegradable packaging materials, natural polymer-based skincare and beauty products, pharmaceutical formulations, and food additives. Additionally, partnerships with local suppliers and manufacturers can help streamline the supply chain and ensure access to raw materials. Investing in research and development to enhance the properties and applications of natural polymers can also lead to innovative product offerings and a competitive edge in the market.
Jordan Agar Market Government Policies
Government policies related to the Tanzania Natural Polymers Market focus on promoting sustainable and eco-friendly practices within the industry. This includes initiatives to support local production of natural polymers, encourage research and development in the sector, and ensure compliance with environmental regulations. The government has implemented measures to incentivize the use of natural polymers in various applications, such as packaging, textiles, and agriculture, to reduce reliance on synthetic materials and promote a more environmentally friendly approach. Additionally, there are efforts to enhance transparency and accountability in the supply chain, improve quality standards, and support local businesses to foster growth and competitiveness in the natural polymers market.
Tanzania Natural Polymers Market Future Outlook
The Tanzania Natural Polymers Market is poised for steady growth in the coming years as the demand for eco-friendly and sustainable materials continues to rise globally. The market is expected to benefit from increasing awareness about the environmental impact of traditional plastics, driving the adoption of natural polymers derived from renewable sources such as plants and animals. Key sectors such as packaging, textiles, and healthcare are likely to drive the market growth as they seek alternatives to conventional polymers. Furthermore, government initiatives promoting the use of natural polymers and investments in research and development are expected to fuel market expansion. Overall, the Tanzania Natural Polymers Market is anticipated to experience a positive trajectory in the foreseeable future, presenting opportunities for innovation and market players to capitalize on the growing demand for environmentally friendly materials.
Key Highlights of the Report:
- Tanzania Natural Polymers Market Outlook
- Market Size of Tanzania Natural Polymers Market, 2021
- Forecast of Tanzania Natural Polymers Market, 2031
- Historical Data and Forecast of Tanzania Natural Polymers Revenues & Volume for the Period 2018 - 2031
- Tanzania Natural Polymers Market Trend Evolution
- Tanzania Natural Polymers Market Drivers and Challenges
- Tanzania Natural Polymers Price Trends
- Tanzania Natural Polymers Porter's Five Forces
- Tanzania Natural Polymers Industry Life Cycle
- Historical Data and Forecast of Tanzania Natural Polymers Market Revenues & Volume By Product Type for the Period 2018 - 2031
- Historical Data and Forecast of Tanzania Natural Polymers Market Revenues & Volume By Cellulose Ethers for the Period 2018 - 2031
- Historical Data and Forecast of Tanzania Natural Polymers Market Revenues & Volume By Exudate And Vegetable Gums for the Period 2018 - 2031
- Historical Data and Forecast of Tanzania Natural Polymers Market Revenues & Volume By Starch And Fermentation Products for the Period 2018 - 2031
- Historical Data and Forecast of Tanzania Natural Polymers Market Revenues & Volume By Other Polymers for the Period 2018 - 2031
- Historical Data and Forecast of Tanzania Natural Polymers Market Revenues & Volume By Industry for the Period 2018 - 2031
- Historical Data and Forecast of Tanzania Natural Polymers Market Revenues & Volume By Packaging Material for the Period 2018 - 2031
- Historical Data and Forecast of Tanzania Natural Polymers Market Revenues & Volume By Medical & Cosmetics for the Period 2018 - 2031
- Historical Data and Forecast of Tanzania Natural Polymers Market Revenues & Volume By Inks & Paints for the Period 2018 - 2031
- Historical Data and Forecast of Tanzania Natural Polymers Market Revenues & Volume By Adhesives for the Period 2018 - 2031
- Tanzania Natural Polymers Import Export Trade Statistics
- Market Opportunity Assessment By Product Type
- Market Opportunity Assessment By Industry
- Tanzania Natural Polymers Top Companies Market Share
- Tanzania Natural Polymers Competitive Benchmarking By Technical and Operational Parameters
- Tanzania Natural Polymers Company Profiles
- Tanzania Natural Polymers Key Strategic Recommendations
Frequently Asked Questions About the Market Study (FAQs):
6Wresearch actively monitors the Tanzania Natural Polymers Market and publishes its comprehensive annual report, highlighting emerging trends, growth drivers, revenue analysis, and forecast outlook. Our insights help businesses to make data-backed strategic decisions with ongoing market dynamics. Our analysts track relevent industries related to the Tanzania Natural Polymers Market, allowing our clients with actionable intelligence and reliable forecasts tailored to emerging regional needs.
Yes, we provide customisation as per your requirements. To learn more, feel free to contact us on sales@6wresearch.com
1 Executive Summary |
2 Introduction |
2.1 Key Highlights of the Report |
2.2 Report Description |
2.3 Market Scope & Segmentation |
2.4 Research Methodology |
2.5 Assumptions |
3 Tanzania Natural Polymers Market Overview |
3.1 Tanzania Country Macro Economic Indicators |
3.2 Tanzania Natural Polymers Market Revenues & Volume, 2021 & 2031F |
3.3 Tanzania Natural Polymers Market - Industry Life Cycle |
3.4 Tanzania Natural Polymers Market - Porter's Five Forces |
3.5 Tanzania Natural Polymers Market Revenues & Volume Share, By Product Type, 2021 & 2031F |
3.6 Tanzania Natural Polymers Market Revenues & Volume Share, By Industry, 2021 & 2031F |
4 Tanzania Natural Polymers Market Dynamics |
4.1 Impact Analysis |
4.2 Market Drivers |
4.2.1 Increasing demand for eco-friendly and sustainable products |
4.2.2 Growing awareness about the benefits of natural polymers over synthetic alternatives |
4.2.3 Rising investments in research and development for natural polymer applications |
4.3 Market Restraints |
4.3.1 Limited availability of raw materials for natural polymers |
4.3.2 High production costs compared to synthetic polymers |
4.3.3 Lack of standardized regulations and certifications in the natural polymer industry |
5 Tanzania Natural Polymers Market Trends |
6 Tanzania Natural Polymers Market, By Types |
6.1 Tanzania Natural Polymers Market, By Product Type |
6.1.1 Overview and Analysis |
6.1.2 Tanzania Natural Polymers Market Revenues & Volume, By Product Type, 2021-2031F |
6.1.3 Tanzania Natural Polymers Market Revenues & Volume, By Cellulose Ethers, 2021-2031F |
6.1.4 Tanzania Natural Polymers Market Revenues & Volume, By Exudate And Vegetable Gums, 2021-2031F |
6.1.5 Tanzania Natural Polymers Market Revenues & Volume, By Starch And Fermentation Products, 2021-2031F |
6.1.6 Tanzania Natural Polymers Market Revenues & Volume, By Other Polymers, 2021-2031F |
6.2 Tanzania Natural Polymers Market, By Industry |
6.2.1 Overview and Analysis |
6.2.2 Tanzania Natural Polymers Market Revenues & Volume, By Packaging Material, 2021-2031F |
6.2.3 Tanzania Natural Polymers Market Revenues & Volume, By Medical & Cosmetics, 2021-2031F |
6.2.4 Tanzania Natural Polymers Market Revenues & Volume, By Inks & Paints, 2021-2031F |
6.2.5 Tanzania Natural Polymers Market Revenues & Volume, By Adhesives, 2021-2031F |
7 Tanzania Natural Polymers Market Import-Export Trade Statistics |
7.1 Tanzania Natural Polymers Market Export to Major Countries |
7.2 Tanzania Natural Polymers Market Imports from Major Countries |
8 Tanzania Natural Polymers Market Key Performance Indicators |
8.1 Percentage increase in research and development expenditure on natural polymer innovations |
8.2 Number of new product launches incorporating natural polymers |
8.3 Growth in the number of partnerships and collaborations in the natural polymer industry |
9 Tanzania Natural Polymers Market - Opportunity Assessment |
9.1 Tanzania Natural Polymers Market Opportunity Assessment, By Product Type, 2021 & 2031F |
9.2 Tanzania Natural Polymers Market Opportunity Assessment, By Industry, 2021 & 2031F |
10 Tanzania Natural Polymers Market - Competitive Landscape |
10.1 Tanzania Natural Polymers Market Revenue Share, By Companies, 2021 |
10.2 Tanzania Natural Polymers Market Competitive Benchmarking, By Operating and Technical Parameters |
11 Company Profiles |
12 Recommendations |
13 Disclaimer |
Export potential assessment - trade Analytics for 2030
Export potential enables firms to identify high-growth global markets with greater confidence by combining advanced trade intelligence with a structured quantitative methodology. The framework analyzes emerging demand trends and country-level import patterns while integrating macroeconomic and trade datasets such as GDP and population forecasts, bilateral import–export flows, tariff structures, elasticity differentials between developed and developing economies, geographic distance, and import demand projections. Using weighted trade values from 2020–2024 as the base period to project country-to-country export potential for 2030, these inputs are operationalized through calculated drivers such as gravity model parameters, tariff impact factors, and projected GDP per-capita growth. Through an analysis of hidden potentials, demand hotspots, and market conditions that are most favorable to success, this method enables firms to focus on target countries, maximize returns, and global expansion with data, backed by accuracy.
By factoring in the projected importer demand gap that is currently unmet and could be potential opportunity, it identifies the potential for the Exporter (Country) among 190 countries, against the general trade analysis, which identifies the biggest importer or exporter.
To discover high-growth global markets and optimize your business strategy:
Click Here
Pricing
- Single User License$ 1,995
- Department License$ 2,400
- Site License$ 3,120
- Global License$ 3,795

Search
Thought Leadership and Analyst Meet


Our Clients
Latest Reports
- United Kingdom (UK) Long-term Care Insurance Market (2026-2032) | Growth, Share, Consumer Insights, Drivers, Opportunities, Competition, Pricing Analysis, Segments, Restraints, Companies, Competitive, Value, Outlook, Size, Demand, Analysis, Challenges, Strategic Insights, Investment Trends, Revenue, Trends, Supply, Forecast
- United Kingdom (UK) Long Term Care Market (2026-2032) | Companies, Outlook, Analysis, Trends, Value, Revenue, Segmentation, Share, Forecast, Competitive Landscape, Growth, Size & Forecast
- Iraq Insulation and Waterproofing Market (2026-2032) | Outlook, Drivers, Growth, Size, Share, Industry, Revenue, Trends, Demand, Competitive, Strategic Insights, Opportunities, Segments, Companies, Challenges, Strategy, Consumer Insights, Analysis, Investment Trends, Value, Segmentation, Forecast, Restraints
- India Switchgear Market Outlook (2026 - 2032) | Size, Share, Trends, Growth, Revenue, Forecast, Analysis, Value, Outlook
- Pakistan Contraceptive Implants Market (2025-2031) | Demand, Growth, Size, Share, Industry, Pricing Analysis, Competitive, Strategic Insights, Strategy, Consumer Insights, Analysis, Investment Trends, Opportunities, Revenue, Segments, Value, Segmentation, Supply, Forecast, Restraints, Outlook, Competition, Drivers, Trends, Companies, Challenges
- Sri Lanka Packaging Market (2026-2032) | Outlook, Competition, Drivers, Trends, Demand, Pricing Analysis, Competitive, Strategic Insights, Companies, Challenges, Strategy, Consumer Insights, Analysis, Investment Trends, Opportunities, Growth, Size, Share, Industry, Revenue, Segments, Value, Segmentation, Supply, Forecast, Restraints
- India Kids Watches Market (2026-2032) | Strategy, Consumer Insights, Analysis, Investment Trends, Opportunities, Growth, Size, Share, Industry, Revenue, Segments, Value, Segmentation, Supply, Forecast, Restraints, Outlook, Competition, Drivers, Trends, Demand, Pricing Analysis, Competitive, Strategic Insights, Companies, Challenges
- Saudi Arabia Core Assurance Service Market (2025-2031) | Strategy, Consumer Insights, Analysis, Investment Trends, Opportunities, Growth, Size, Share, Industry, Revenue, Segments, Value, Segmentation, Supply, Forecast, Restraints, Outlook, Competition, Drivers, Trends, Demand, Pricing Analysis, Competitive, Strategic Insights, Companies, Challenges
- Romania Uninterruptible Power Supply (UPS) Market (2026-2032) | Industry, Analysis, Revenue, Size, Forecast, Outlook, Value, Trends, Share, Growth & Companies
- Saudi Arabia Car Window Tinting Film, Paint Protection Film (PPF), and Ceramic Coating Market (2025-2031) | Strategy, Consumer Insights, Analysis, Investment Trends, Opportunities, Growth, Size, Share, Industry, Revenue, Segments, Value, Segmentation, Supply, Forecast, Restraints, Outlook, Competition, Drivers, Trends, Demand, Pricing Analysis, Competitive, Strategic Insights, Companies, Challenges
Industry Events and Analyst Meet

India EV Show 2026

EV tech India Expo 2026

Auto Tech Asia 2026

Battery Tech India 2026

Smart Production Solutions Guangzhou 2026
Whitepaper
- Middle East & Africa Commercial Security Market Click here to view more.
- Middle East & Africa Fire Safety Systems & Equipment Market Click here to view more.
- GCC Drone Market Click here to view more.
- Middle East Lighting Fixture Market Click here to view more.
- GCC Physical & Perimeter Security Market Click here to view more.
6WResearch In News
- Doha a strategic location for EV manufacturing hub: IPA Qatar
- Demand for luxury TVs surging in the GCC, says Samsung
- Empowering Growth: The Thriving Journey of Bangladesh’s Cable Industry
- Demand for luxury TVs surging in the GCC, says Samsung
- Video call with a traditional healer? Once unthinkable, it’s now common in South Africa
- Intelligent Buildings To Smooth GCC’s Path To Net Zero