United States Carbon Market (2025-2031) | Companies, Analysis, Growth, Outlook, Share, Revenue, Industry, Size, Trends, Value & Forecast
Market Forecast By Product Types (Amorphous Carbon, Graphite, Diamond), By Applications (Automotive, Construction, Engineering Industries, Aerospace, Others) And Competitive Landscape
| Product Code: ETC004166 | Publication Date: Sep 2020 | Updated Date: Nov 2025 | Product Type: Report | |
| Publisher: 6Wresearch | Author: Ravi Bhandari | No. of Pages: 70 | No. of Figures: 35 | No. of Tables: 5 |
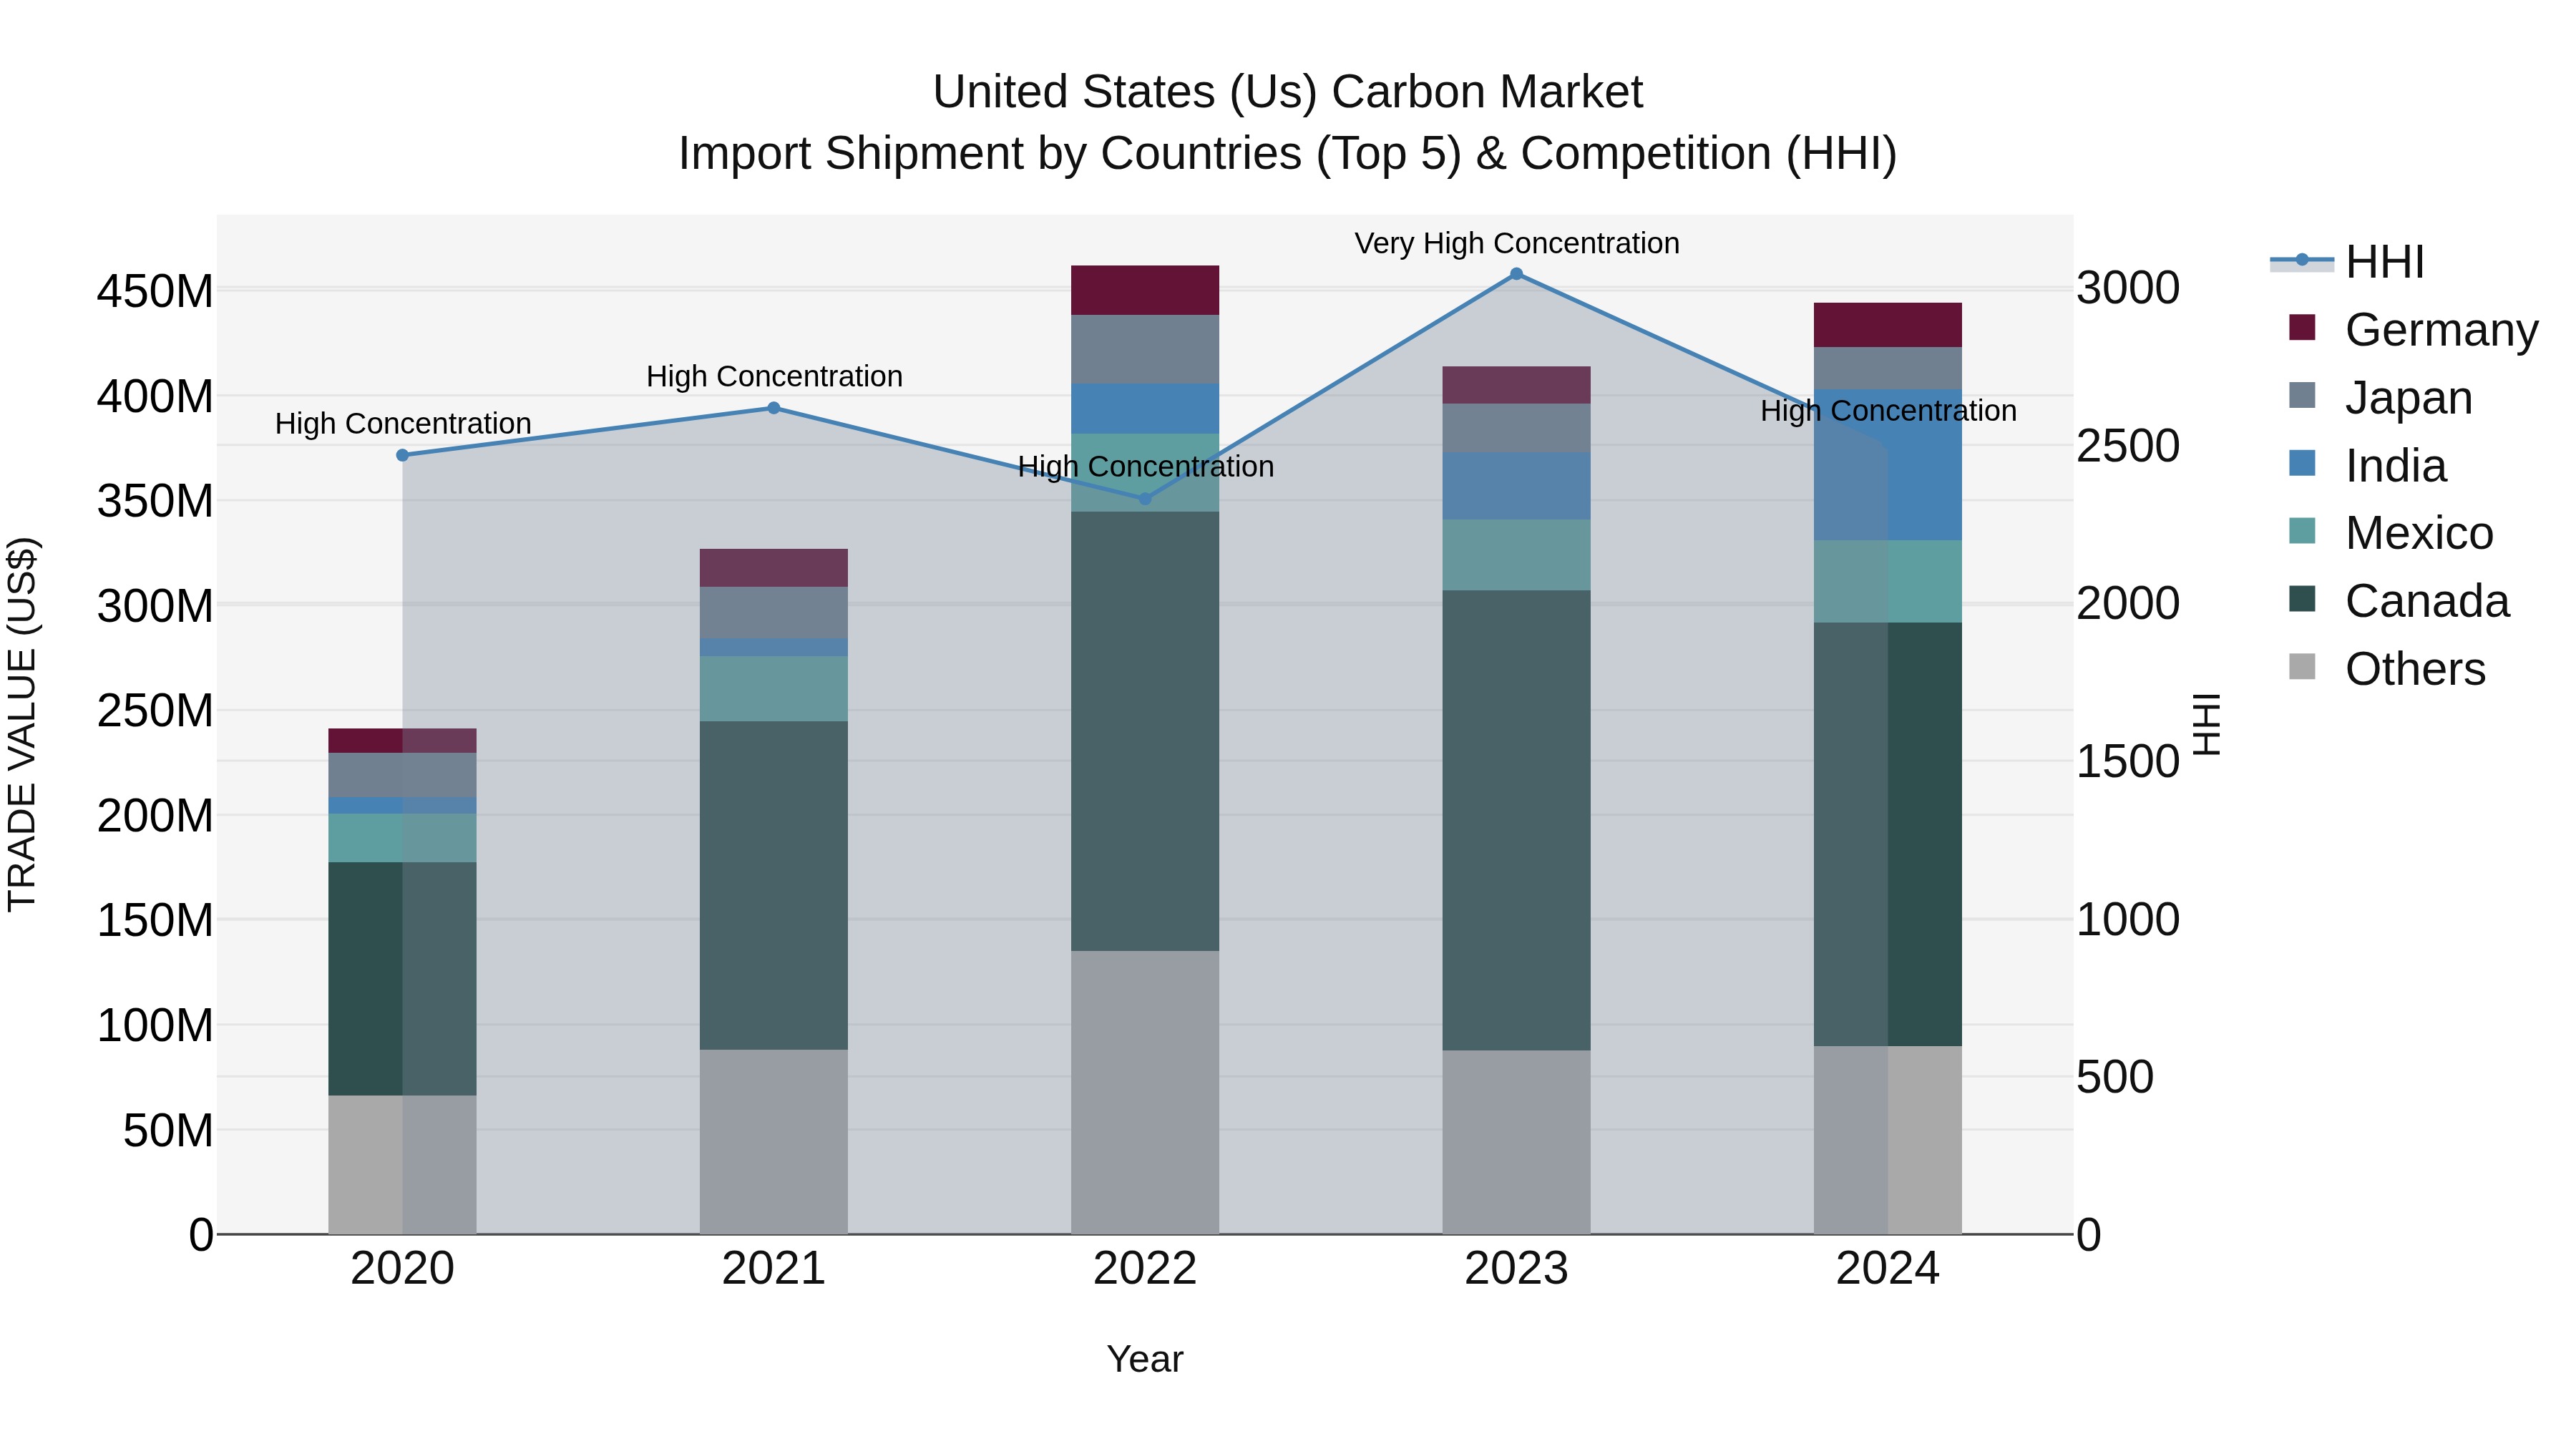
United States (US) Carbon Market Top 5 Importing Countries and Market Competition (HHI) Analysis
The United States saw a significant increase in carbon import shipments in 2024, with top exporters being Canada, India, Mexico, Singapore, and Germany. The market concentration, as measured by the HHI, remained high in 2024, indicating a competitive landscape. The impressive compound annual growth rate (CAGR) of 16.5% from 2020 to 2024 reflects the growing demand for carbon imports in the US market. Moreover, the growth rate of 7.37% from 2023 to 2024 suggests a continued upward trajectory, presenting opportunities for both domestic and international players in the carbon import industry.
Topics Covered in the United States Carbon Market Report
United States Carbon Market report thoroughly covers the market by product types, and by Applications. The market report provides an unbiased and detailed analysis of the ongoing market trends, opportunities/high growth areas, and market drivers which would help the stakeholders to devise and align their market strategies according to the current and future market dynamics.
United States Carbon Market Synopsis
United States Carbon Market is experiencing steady growth, driven by increasing environmental regulations and corporate sustainability initiatives. The market benefits from the rising adoption of carbon credits and emissions trading schemes, aimed at reducing greenhouse gas emissions. Technological advancements in carbon capture and storage further contribute to market expansion. However, regulatory complexities and varying state policies pose challenges to market development.
According to 6Wresearch, the United States Carbon Market is estimated to reach at CAGR of 10.5% during the forecast period 2025-2031.This growth is primarily driven by increasing regulatory efforts to curb greenhouse gas emissions, alongside rising corporate commitments toward sustainability. The expansion of emissions trading systems and the growing adoption of carbon offset programs by industries seeking to comply with environmental mandates further contribute to market growth. Additionally, advancements in carbon capture, utilization, and storage (CCUS) technologies are supporting the reduction of carbon footprints across various sectors. The energy sector, particularly renewable energy initiatives, plays a crucial role in the market’s expansion as companies transition towards cleaner energy sources.
Despite the positive outlook, the market faces several challenges. The regulatory landscape in the United States is complex, with federal and state policies often differing in scope and implementation. This variation creates uncertainty for businesses operating across multiple states. Moreover, while carbon offset programs provide opportunities for emission reductions, concerns regarding the transparency and credibility of carbon credits remain a significant challenge. Additionally, the high initial investment required for adopting carbon capture technologies and integrating sustainable practices into industrial processes may hinder market adoption. Market participants must navigate these challenges while leveraging innovation and policy developments to sustain long-term growth. Addressing regulatory inconsistencies and ensuring the reliability of carbon credit systems will be critical for fostering a more robust and efficient carbon market.
United States Carbon Market Trends
United States carbon market is experiencing notable growth due to increasing regulatory measures and corporate sustainability commitments. The expansion of cap-and-trade programs, along with rising participation in voluntary carbon offset initiatives, is driving market momentum. Companies across various industries are integrating carbon credits into their sustainability strategies, seeking to reduce emissions while complying with evolving environmental regulations. Moreover, advancements in carbon capture, utilization, and storage (CCUS) technologies are playing a pivotal role in shaping market dynamics by enabling industries to lower their carbon footprints effectively.
Additionally, the transition toward renewable energy sources is significantly influencing market trends, as businesses invest in cleaner energy alternatives to mitigate carbon emissions. Financial institutions are also contributing to market expansion by incorporating environmental, social, and governance (ESG) considerations into their investment decisions. However, market growth is challenged by regulatory inconsistencies across federal and state levels, which create complexities for businesses operating nationwide. Ensuring the transparency and credibility of carbon credit programs remains essential to maintaining market trust. Despite these challenges, the United States carbon market is expected to witness continued development, supported by policy advancements, technological innovations, and a growing emphasis on corporate environmental responsibility.
Investments Opportunities in the United States Carbon Market
United States Carbon Market Growth is driven by regulatory policies, technological advancements, and increasing investments in sustainability. United States carbon market presents significant investment opportunities driven by regulatory policies, corporate sustainability initiatives, and technological advancements. The expansion of cap-and-trade programs and the increasing adoption of voluntary carbon offset projects provide a lucrative landscape for investors seeking to support emission reduction efforts. The development of carbon capture, utilization, and storage (CCUS) technologies offers promising prospects, as industries strive to comply with stringent environmental regulations while maintaining operational efficiency. Furthermore, renewable energy projects, such as wind, solar, and biomass, are gaining traction as businesses and governments prioritize sustainable energy solutions. Investment in forestry and land-use carbon offset programs also continues to rise, reflecting growing interest in nature-based solutions for carbon sequestration. Financial institutions are increasingly incorporating environmental, social, and governance (ESG) factors into their investment strategies, further enhancing market expansion.
Leading Players in the United States Carbon Market
United States carbon market is highly competitive, with several key players actively contributing to market expansion through innovative solutions and strategic initiatives. Companies such as Chevron Corporation, ExxonMobil, and BP America are leading industry efforts by investing in carbon capture, utilization, and storage (CCUS) technologies to mitigate emissions from their operations. These firms are also engaging in carbon credit trading and offset programs to comply with environmental regulations and sustainability commitments. Tesla, Inc. plays a significant role in the market by promoting clean energy solutions, including electric vehicles and battery storage, which contribute to reducing carbon footprints.
Verra and Gold Standard serve as major certifiers of carbon credits, ensuring transparency and credibility in carbon offset projects. Additionally, Microsoft Corporation and Google LLC have emerged as influential players by investing in carbon removal technologies and pledging to achieve carbon neutrality through direct air capture and nature-based solutions. Other notable companies, such as Southern Company and Duke Energy, are transitioning towards cleaner energy sources, enhancing the carbon credit market through renewable energy investments.
Government Regulations
Government regulations play a pivotal role in shaping the United States carbon industry by establishing frameworks that drive emission reductions and sustainability initiatives. The federal government, through agencies such as the Environmental Protection Agency (EPA), enforces regulations like the Clean Air Act, which sets limits on greenhouse gas (GHG) emissions and encourages industries to adopt cleaner technologies. Additionally, the Inflation Reduction Act (IRA) of 2025 has introduced substantial incentives for businesses investing in carbon capture, renewable energy, and emission reduction projects.
At the state level, programs such as California’s Cap-and-Trade Program and the Regional Greenhouse Gas Initiative (RGGI) in the Northeast impose carbon pricing mechanisms that require businesses to purchase allowances for their emissions. These initiatives not only regulate industrial carbon output but also create a structured market for carbon credit trading. Furthermore, companies are required to adhere to the SEC’s proposed climate disclosure rules, which mandate transparency in carbon footprint reporting and sustainability practices. The federal push towards net-zero emissions by 2031 is expected to bring stricter regulations and increased investments in carbon mitigation technologies. While these policies foster sustainability, they also pose compliance challenges for industries, requiring significant capital investment and operational adjustments.
Future Insights of the United States Carbon Market
The future of the United States carbon market is poised for substantial growth, driven by stringent environmental policies, technological advancements, and increasing corporate commitment to sustainability. The federal government’s goal of achieving net-zero emissions by 2031 will further accelerate investments in carbon capture, utilization, and storage (CCUS) technologies, along with the expansion of renewable energy sources. Programs such as the Inflation Reduction Act (IRA) will continue to provide financial incentives for industries transitioning toward low-carbon solutions. Market dynamics will also be influenced by the expansion of cap-and-trade programs, such as California’s Cap-and-Trade Program and the Regional Greenhouse Gas Initiative (RGGI), which promote carbon pricing mechanisms and emissions trading. Additionally, corporate participation in voluntary carbon markets is expected to rise, as businesses seek to offset emissions and comply with evolving sustainability regulations, including the Securities and Exchange Commission’s (SEC) proposed climate disclosure rules.
Market Segmentation Analysis
The Report offers a comprehensive study of the subsequent market segments and their leading categories.
Graphite to Dominate the Market-By Product Types
In the United States carbon market, graphite is expected to experience significant growth among product types due to its rising demand in energy storage solutions, electric vehicle batteries, and various industrial applications. Its unique properties, such as high conductivity, chemical stability, and ability to withstand extreme temperatures, make it an essential material for modern technological advancements. These attributes not only solidify graphite's role in achieving energy efficiency but also position it as a critical component in the transition to a low-carbon economy.
Automotive to Dominate the Market -By Applications
According to Saurabh, Senior Research Analyst, 6Wresearch, the automotive sector is expected to dominate as the United States carbon market share. With stringent emissions regulations and a growing focus on reducing fossil fuel dependence, automakers are increasingly turning to electric vehicles (EVs) as a sustainable alternative.
Key Attractiveness of the Report
- 10 Years of Market Numbers.
- Historical Data Starting from 2021 to 2024.
- Base Year: 2024
- Forecast Data until 2031.
- Key Performance Indicators Impacting the market.
- Major Upcoming Developments and Projects.
Key Highlights of the Report:
- United States Carbon Market Overview
- United States Carbon Market Outlook
- Market Size of United States Carbon Market, 2024
- Forecast of United States Carbon Market, 2031
- Historical Data and Forecast of United States Carbon Revenues & Volume for the Period 2021 - 2031
- United States Carbon Market Trend Evolution
- United States Carbon Market Drivers and Challenges
- United States Carbon Price Trends
- United States Carbon Porter's Five Forces
- United States Carbon Industry Life Cycle
- Historical Data and Forecast of United States Carbon Market Revenues & Volume By Product Types for the Period 2021 - 2031
- Historical Data and Forecast of United States Carbon Market Revenues & Volume By Amorphous Carbon for the Period 2021 - 2031
- Historical Data and Forecast of United States Carbon Market Revenues & Volume By Graphite for the Period 2021 - 2031
- Historical Data and Forecast of United States Carbon Market Revenues & Volume By Diamond for the Period 2021 - 2031
- Historical Data and Forecast of United States Carbon Market Revenues & Volume By Applications for the Period 2021 - 2031
- Historical Data and Forecast of United States Carbon Market Revenues & Volume By Automotive for the Period 2021 - 2031
- Historical Data and Forecast of United States Carbon Market Revenues & Volume By Construction for the Period 2021 - 2031
- Historical Data and Forecast of United States Carbon Market Revenues & Volume By Engineering Industries for the Period 2021 - 2031
- Historical Data and Forecast of United States Carbon Market Revenues & Volume By Aerospace for the Period 2021 - 2031
- Historical Data and Forecast of United States Carbon Market Revenues & Volume By Others for the Period 2021 - 2031
- United States Carbon Import Export Trade Statistics
- Market Opportunity Assessment By Product Types
- Market Opportunity Assessment By Applications
- United States Carbon Top Companies Market Share
- United States Carbon Competitive Benchmarking By Technical and Operational Parameters
- United States Carbon Company Profiles
- United States Carbon Key Strategic Recommendations
Market Segmentation Analysis
The Report offers a comprehensive study of the subsequent market segments and their leading categories.
By Product Types
- Amorphous Carbon
- Graphite
- Diamond
By Applications
- Automotive
- Construction
- Engineering Industries
- Aerospace
- Others
United States Carbon Market (2025-2031): FAQs
The market is expanding due to stricter emissions regulations, increased corporate sustainability initiatives, and advancements in carbon capture technologies.
Key challenges include regulatory uncertainties, the high costs of decolonization, and the need for standardized carbon pricing mechanisms.
The market is expected to grow significantly, driven by federal climate policies, expansion of emissions trading programs, and technological innovations.
The government provides incentives through policies like the Inflation Reduction Act, cap-and-trade programs, and investments in clean energy initiatives.
6Wresearch actively monitors the United States Carbon Market and publishes its comprehensive annual report, highlighting emerging trends, growth drivers, revenue analysis, and forecast outlook. Our insights help businesses to make data-backed strategic decisions with ongoing market dynamics. Our analysts track relevent industries related to the United States Carbon Market, allowing our clients with actionable intelligence and reliable forecasts tailored to emerging regional needs.
Yes, we provide customisation as per your requirements. To learn more, feel free to contact us on sales@6wresearch.com
Global Go To Market Strategy - 2030
Export potential enables firms to identify high-growth global markets with greater confidence by combining advanced trade intelligence with a structured quantitative methodology. The framework analyzes emerging demand trends and country-level import patterns while integrating macroeconomic and trade datasets such as GDP and population forecasts, bilateral import–export flows, tariff structures, elasticity differentials between developed and developing economies, geographic distance, and import demand projections. Using weighted trade values from 2020–2024 as the base period to project country-to-country export potential for 2030, these inputs are operationalized through calculated drivers such as gravity model parameters, tariff impact factors, and projected GDP per-capita growth. Through an analysis of hidden potentials, demand hotspots, and market conditions that are most favorable to success, this method enables firms to focus on target countries, maximize returns, and global expansion with data, backed by accuracy.
By factoring in the projected importer demand gap that is currently unmet and could be potential opportunity, it identifies the potential for the Exporter (Country) among 190 countries, against the general trade analysis, which identifies the biggest importer or exporter.
To discover high-growth global markets and optimize your business strategy:
Click Here
Pricing
- Single User License$ 1,995
- Department License$ 2,400
- Site License$ 3,120
- Global License$ 3,795

Leadership Perspectives from Industry Events
Search
Thought Leadership and Analyst Meet


Our Clients
6WResearch In News
- India Air Conditioner Market Set for Strong Rebound in 2026 After Weather-Led Correction and GST-Driven Recovery: 6Wresearch
- ADAS in India: How Automatic Emergency Braking, Blind Spot Detection & Driver Monitoring are Transforming Road Safety
- Doha a strategic location for EV manufacturing hub: IPA Qatar
- Demand for luxury TVs surging in the GCC, says Samsung
- Empowering Growth: The Thriving Journey of Bangladesh’s Cable Industry
- Demand for luxury TVs surging in the GCC, says Samsung
Latest Reports
- Nicaragua RPG Gaming Market (2026-2032)
- New Zealand RPG Gaming Market (2026-2032)
- Netherlands RPG Gaming Market (2026-2032)
- Nauru RPG Gaming Market (2026-2032)
- Namibia RPG Gaming Market (2026-2032)
- Mozambique RPG Gaming Market (2026-2032)
- Montenegro RPG Gaming Market (2026-2032)
- Mongolia RPG Gaming Market (2026-2032)
- Monaco RPG Gaming Market (2026-2032)
- Micronesia RPG Gaming Market (2026-2032)
Industry Events and Analyst Meet

HIMTEX 2026

India Refining Summit 2026

India EV Show 2026

EV tech India Expo 2026

Auto Tech Asia 2026
Whitepaper
- Middle East & Africa Commercial Security Market Click here to view more.
- Middle East & Africa Fire Safety Systems & Equipment Market Click here to view more.
- GCC Drone Market Click here to view more.
- Middle East Lighting Fixture Market Click here to view more.
- GCC Physical & Perimeter Security Market Click here to view more.