United States (US) Bath Salt Market Outlook | COVID-19 IMPACT, Growth, Analysis, Trends, Forecast, Share, Revenue, Size, Value, Companies & Industry
Market Forecast By Type (Atlantic Salt, Crystal Salt, Dead Sea Salt, Epsom Salt, Others), By Form (Granular, Powder, Coarse, Others), By Distribution Channel (Store Based, Non Store Based) And Competitive Landscape
| Product Code: ETC314161 | Publication Date: Aug 2022 | Updated Date: Nov 2025 | Product Type: Market Research Report | |
| Publisher: 6Wresearch | Author: Ravi Bhandari | No. of Pages: 75 | No. of Figures: 35 | No. of Tables: 20 |
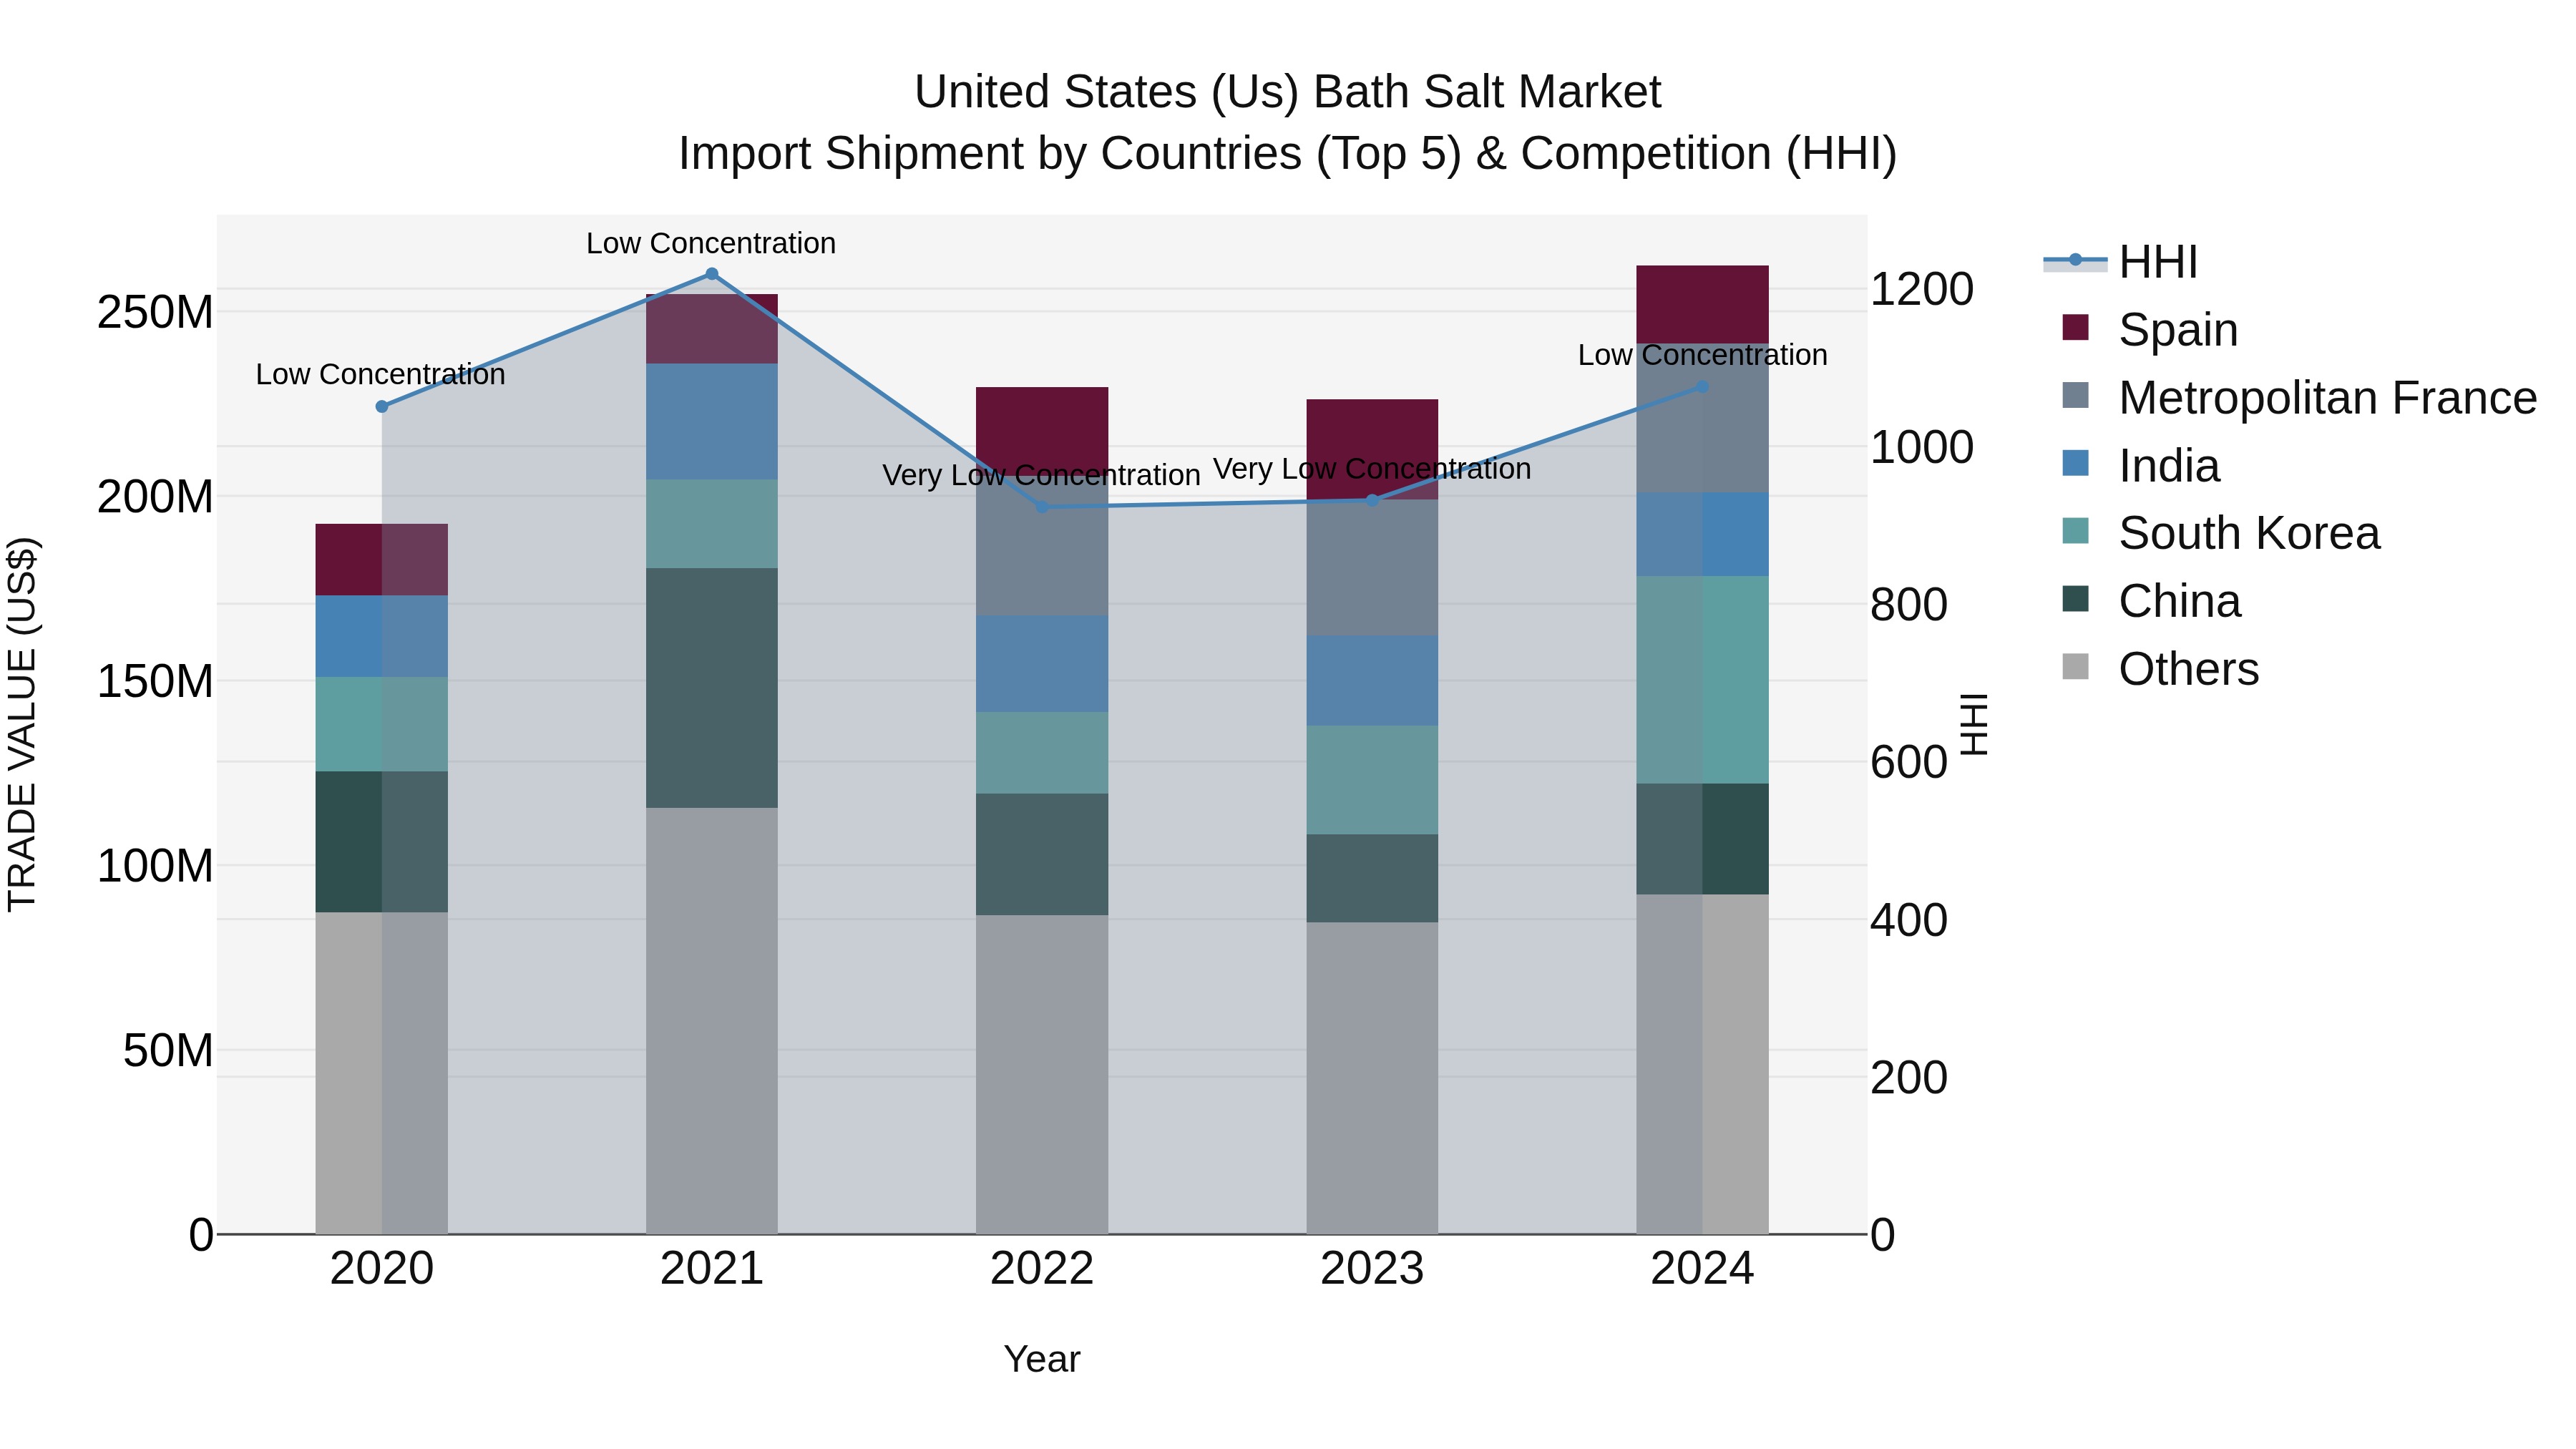
United States (US) Bath Salt Market Top 5 Importing Countries and Market Competition (HHI) Analysis
The United States saw a notable increase in bath salt import shipments in 2024, with key exporting countries including South Korea, Metropolitan France, China, India, and Spain. The market exhibited a low concentration level, indicating a diverse range of sources for these imports. The compound annual growth rate (CAGR) from 2020 to 2024 stood at a healthy 8.05%, with a significant growth spurt of 16.03% from 2023 to 2024. This data suggests a growing demand for bath salts in the US market, with a variety of countries contributing to its supply.
USA Export Potential Assessment For Bath Salt Market (Values in USD Thousand)
United States (US) Bath Salt Market Synopsis
The United States Bath Salt Market is a growing industry driven by increasing consumer interest in self-care and relaxation products. The market offers a wide range of bath salts, including Epsom salts, Himalayan salts, and scented bath salts, catering to various preferences and needs. Key trends in the market include the rising popularity of organic and natural ingredients, as well as innovative formulations such as CBD-infused bath salts. Major players in the US Bath Salt Market include Dr Teal`s, Herbivore Botanicals, and Village Naturals Therapy. With the ongoing trend of wellness and self-care, the market is expected to continue its growth trajectory, driven by consumers seeking therapeutic and indulgent bath experiences. Marketing strategies focusing on product quality, unique formulations, and health benefits are crucial for companies looking to succeed in this competitive market.
United States (US) Bath Salt Market Trends
The US bath salt market is currently experiencing a shift towards natural and organic products, driven by increasing consumer awareness of the potential benefits of using chemical-free and sustainable ingredients in personal care products. Customers are seeking out bath salts that are cruelty-free, environmentally friendly, and free from artificial additives. There is also a growing demand for bath salts infused with essential oils for aromatherapy purposes, catering to consumers looking for relaxation and stress relief in their bathing routines. Additionally, there is a rising interest in unique and exotic bath salt blends, such as Himalayan pink salt or Dead Sea salt, as consumers seek out luxurious and indulgent bathing experiences. Overall, the trend in the US bath salt market is moving towards premium, natural ingredients and innovative product offerings to meet the evolving preferences of health-conscious consumers.
United States (US) Bath Salt Market Challenges
The US Bath Salt Market faces several challenges, including increasing competition from both established and new brands, fluctuating raw material costs, and changing consumer preferences towards natural and organic products. Additionally, regulatory requirements and compliance issues, such as labeling and product safety standards, pose challenges for manufacturers and retailers in the industry. The market is also impacted by economic factors, such as disposable income levels and consumer spending habits, which can influence purchasing decisions. To succeed in this competitive market, companies need to innovate with new product offerings, maintain quality standards, and effectively market their products to target audiences.
United States (US) Bath Salt Market Investment Opportunities
The US Bath Salt Market presents several investment opportunities for savvy investors. With the growing trend of self-care and wellness, there is an increasing demand for natural and organic bath salts that offer relaxation and therapeutic benefits. Investing in innovative product formulations, unique packaging designs, and marketing strategies to target specific consumer segments such as millennials or eco-conscious individuals can provide a competitive edge. Additionally, leveraging e-commerce platforms and social media marketing to reach a broader audience and establish brand presence is crucial in this market. Collaborating with beauty influencers or wellness experts can also help in building credibility and driving sales. Overall, investing in the US Bath Salt Market offers opportunities for growth and profitability in a rapidly expanding industry.
Jordan Agar Market Government Policies
In the United States, the bath salt market is regulated by various government policies to ensure consumer safety and compliance with industry standards. The Food and Drug Administration (FDA) oversees the labeling and marketing of bath salts to prevent misleading claims and harmful ingredients. Additionally, the Consumer Product Safety Commission (CPSC) sets guidelines for product safety and packaging to protect consumers from potential hazards. The Environmental Protection Agency (EPA) also regulates the disposal of bath salts to prevent environmental contamination. Overall, these government policies aim to maintain the quality and safety of bath salt products in the US market while ensuring compliance with regulatory standards.
United States (US) Bath Salt Market Future Outlook
The United States bath salt market is expected to witness steady growth in the coming years, driven by factors such as increasing consumer awareness about the benefits of self-care and relaxation, as well as the growing popularity of natural and organic bath products. The market is also likely to benefit from the rising trend of home spa experiences and the expanding range of innovative bath salt products tailored to different skin types and preferences. Additionally, the influence of social media and online influencers in promoting self-care routines and wellness products is expected to further boost market demand. With a focus on wellness and self-care continuing to gain traction among consumers, the US bath salt market is poised for growth and innovation in the foreseeable future.
Key Highlights of the Report:
- United States (US) Bath Salt Market Outlook
- Market Size of United States (US) Bath Salt Market, 2021
- Forecast of United States (US) Bath Salt Market, 2031
- Historical Data and Forecast of United States (US) Bath Salt Revenues & Volume for the Period 2018 - 2031
- United States (US) Bath Salt Market Trend Evolution
- United States (US) Bath Salt Market Drivers and Challenges
- United States (US) Bath Salt Price Trends
- United States (US) Bath Salt Porter's Five Forces
- United States (US) Bath Salt Industry Life Cycle
- Historical Data and Forecast of United States (US) Bath Salt Market Revenues & Volume By Type for the Period 2018 - 2031
- Historical Data and Forecast of United States (US) Bath Salt Market Revenues & Volume By Atlantic Salt for the Period 2018 - 2031
- Historical Data and Forecast of United States (US) Bath Salt Market Revenues & Volume By Crystal Salt for the Period 2018 - 2031
- Historical Data and Forecast of United States (US) Bath Salt Market Revenues & Volume By Dead Sea Salt for the Period 2018 - 2031
- Historical Data and Forecast of United States (US) Bath Salt Market Revenues & Volume By Epsom Salt for the Period 2018 - 2031
- Historical Data and Forecast of United States (US) Bath Salt Market Revenues & Volume By Others for the Period 2018 - 2031
- Historical Data and Forecast of United States (US) Bath Salt Market Revenues & Volume By Form for the Period 2018 - 2031
- Historical Data and Forecast of United States (US) Bath Salt Market Revenues & Volume By Granular for the Period 2018 - 2031
- Historical Data and Forecast of United States (US) Bath Salt Market Revenues & Volume By Powder for the Period 2018 - 2031
- Historical Data and Forecast of United States (US) Bath Salt Market Revenues & Volume By Coarse for the Period 2018 - 2031
- Historical Data and Forecast of United States (US) Bath Salt Market Revenues & Volume By Others for the Period 2018 - 2031
- Historical Data and Forecast of United States (US) Bath Salt Market Revenues & Volume By Distribution Channel for the Period 2018 - 2031
- Historical Data and Forecast of United States (US) Bath Salt Market Revenues & Volume By Store Based for the Period 2018 - 2031
- Historical Data and Forecast of United States (US) Bath Salt Market Revenues & Volume By Non Store Based for the Period 2018 - 2031
- United States (US) Bath Salt Import Export Trade Statistics
- Market Opportunity Assessment By Type
- Market Opportunity Assessment By Form
- Market Opportunity Assessment By Distribution Channel
- United States (US) Bath Salt Top Companies Market Share
- United States (US) Bath Salt Competitive Benchmarking By Technical and Operational Parameters
- United States (US) Bath Salt Company Profiles
- United States (US) Bath Salt Key Strategic Recommendations
Frequently Asked Questions About the Market Study (FAQs):
6Wresearch actively monitors the United States (US) Bath Salt Market and publishes its comprehensive annual report, highlighting emerging trends, growth drivers, revenue analysis, and forecast outlook. Our insights help businesses to make data-backed strategic decisions with ongoing market dynamics. Our analysts track relevent industries related to the United States (US) Bath Salt Market, allowing our clients with actionable intelligence and reliable forecasts tailored to emerging regional needs.
Yes, we provide customisation as per your requirements. To learn more, feel free to contact us on sales@6wresearch.com
1 Executive Summary |
2 Introduction |
2.1 Key Highlights of the Report |
2.2 Report Description |
2.3 Market Scope & Segmentation |
2.4 Research Methodology |
2.5 Assumptions |
3 United States (US) Bath Salt Market Overview |
3.1 United States (US) Country Macro Economic Indicators |
3.2 United States (US) Bath Salt Market Revenues & Volume, 2021 & 2031F |
3.3 United States (US) Bath Salt Market - Industry Life Cycle |
3.4 United States (US) Bath Salt Market - Porter's Five Forces |
3.5 United States (US) Bath Salt Market Revenues & Volume Share, By Type, 2021 & 2031F |
3.6 United States (US) Bath Salt Market Revenues & Volume Share, By Form, 2021 & 2031F |
3.7 United States (US) Bath Salt Market Revenues & Volume Share, By Distribution Channel, 2021 & 2031F |
4 United States (US) Bath Salt Market Dynamics |
4.1 Impact Analysis |
4.2 Market Drivers |
4.2.1 Increasing consumer awareness about the benefits of using natural and organic bath salts |
4.2.2 Growing popularity of self-care and wellness trends promoting the use of bath salts |
4.2.3 Rising demand for luxury bath products and spa-like experiences at home |
4.3 Market Restraints |
4.3.1 Price fluctuations in raw materials used for bath salt production |
4.3.2 Competition from alternative bath products like bath bombs and oils |
4.3.3 Regulatory challenges related to labeling and safety standards for bath salt products |
5 United States (US) Bath Salt Market Trends |
6 United States (US) Bath Salt Market, By Types |
6.1 United States (US) Bath Salt Market, By Type |
6.1.1 Overview and Analysis |
6.1.2 United States (US) Bath Salt Market Revenues & Volume, By Type, 2021-2031F |
6.1.3 United States (US) Bath Salt Market Revenues & Volume, By Atlantic Salt, 2021-2031F |
6.1.4 United States (US) Bath Salt Market Revenues & Volume, By Crystal Salt, 2021-2031F |
6.1.5 United States (US) Bath Salt Market Revenues & Volume, By Dead Sea Salt, 2021-2031F |
6.1.6 United States (US) Bath Salt Market Revenues & Volume, By Epsom Salt, 2021-2031F |
6.1.7 United States (US) Bath Salt Market Revenues & Volume, By Others, 2021-2031F |
6.2 United States (US) Bath Salt Market, By Form |
6.2.1 Overview and Analysis |
6.2.2 United States (US) Bath Salt Market Revenues & Volume, By Granular, 2021-2031F |
6.2.3 United States (US) Bath Salt Market Revenues & Volume, By Powder, 2021-2031F |
6.2.4 United States (US) Bath Salt Market Revenues & Volume, By Coarse, 2021-2031F |
6.2.5 United States (US) Bath Salt Market Revenues & Volume, By Others, 2021-2031F |
6.3 United States (US) Bath Salt Market, By Distribution Channel |
6.3.1 Overview and Analysis |
6.3.2 United States (US) Bath Salt Market Revenues & Volume, By Store Based, 2021-2031F |
6.3.3 United States (US) Bath Salt Market Revenues & Volume, By Non Store Based, 2021-2031F |
7 United States (US) Bath Salt Market Import-Export Trade Statistics |
7.1 United States (US) Bath Salt Market Export to Major Countries |
7.2 United States (US) Bath Salt Market Imports from Major Countries |
8 United States (US) Bath Salt Market Key Performance Indicators |
8.1 Consumer engagement on social media platforms related to bath salt usage and trends |
8.2 Number of new product launches and innovations in the bath salt market |
8.3 Growth in the number of spa and wellness centers offering bath salt treatments |
9 United States (US) Bath Salt Market - Opportunity Assessment |
9.1 United States (US) Bath Salt Market Opportunity Assessment, By Type, 2021 & 2031F |
9.2 United States (US) Bath Salt Market Opportunity Assessment, By Form, 2021 & 2031F |
9.3 United States (US) Bath Salt Market Opportunity Assessment, By Distribution Channel, 2021 & 2031F |
10 United States (US) Bath Salt Market - Competitive Landscape |
10.1 United States (US) Bath Salt Market Revenue Share, By Companies, 2021 |
10.2 United States (US) Bath Salt Market Competitive Benchmarking, By Operating and Technical Parameters |
11 Company Profiles |
12 Recommendations |
13 Disclaimer |
Global Go To Market Strategy - 2030
Export potential enables firms to identify high-growth global markets with greater confidence by combining advanced trade intelligence with a structured quantitative methodology. The framework analyzes emerging demand trends and country-level import patterns while integrating macroeconomic and trade datasets such as GDP and population forecasts, bilateral import–export flows, tariff structures, elasticity differentials between developed and developing economies, geographic distance, and import demand projections. Using weighted trade values from 2020–2024 as the base period to project country-to-country export potential for 2030, these inputs are operationalized through calculated drivers such as gravity model parameters, tariff impact factors, and projected GDP per-capita growth. Through an analysis of hidden potentials, demand hotspots, and market conditions that are most favorable to success, this method enables firms to focus on target countries, maximize returns, and global expansion with data, backed by accuracy.
By factoring in the projected importer demand gap that is currently unmet and could be potential opportunity, it identifies the potential for the Exporter (Country) among 190 countries, against the general trade analysis, which identifies the biggest importer or exporter.
To discover high-growth global markets and optimize your business strategy:
Click Here
Pricing
- Single User License$ 1,995
- Department License$ 2,400
- Site License$ 3,120
- Global License$ 3,795

Leadership Perspectives from Industry Events
Search
Thought Leadership and Analyst Meet


Our Clients
6WResearch In News
- India Air Conditioner Market Set for Strong Rebound in 2026 After Weather-Led Correction and GST-Driven Recovery: 6Wresearch
- ADAS in India: How Automatic Emergency Braking, Blind Spot Detection & Driver Monitoring are Transforming Road Safety
- Doha a strategic location for EV manufacturing hub: IPA Qatar
- Demand for luxury TVs surging in the GCC, says Samsung
- Empowering Growth: The Thriving Journey of Bangladesh’s Cable Industry
- Demand for luxury TVs surging in the GCC, says Samsung
Latest Reports
- Nicaragua RPG Gaming Market (2026-2032)
- New Zealand RPG Gaming Market (2026-2032)
- Netherlands RPG Gaming Market (2026-2032)
- Nauru RPG Gaming Market (2026-2032)
- Namibia RPG Gaming Market (2026-2032)
- Mozambique RPG Gaming Market (2026-2032)
- Montenegro RPG Gaming Market (2026-2032)
- Mongolia RPG Gaming Market (2026-2032)
- Monaco RPG Gaming Market (2026-2032)
- Micronesia RPG Gaming Market (2026-2032)
Industry Events and Analyst Meet

HIMTEX 2026

India Refining Summit 2026

India EV Show 2026

EV tech India Expo 2026

Auto Tech Asia 2026
Whitepaper
- Middle East & Africa Commercial Security Market Click here to view more.
- Middle East & Africa Fire Safety Systems & Equipment Market Click here to view more.
- GCC Drone Market Click here to view more.
- Middle East Lighting Fixture Market Click here to view more.
- GCC Physical & Perimeter Security Market Click here to view more.