United States (US) Lavatory Service Vehicles Market (2026-2032) | Revenue, Companies, Share, Growth, Size, COVID-19 IMPACT, Forecast, Industry, Analysis, Trends & Value
Market Forecast By Power (Electric, Non-Electric, Hybrid), By Capacity (<50 gallons, 50-100 gallons, 101-200 gallons, >200 gallons), By Vehicle (Trucks, Carts), By Application (Commercial, Defence) And Competitive Landscape
| Product Code: ETC174800 | Publication Date: Jan 2022 | Updated Date: Jun 2026 | Product Type: Market Research Report | |
| Publisher: 6Wresearch | Author: Shubham Deep | No. of Pages: 70 | No. of Figures: 35 | No. of Tables: 5 |
United States (US) Lavatory Service Vehicles Market Size, Share & Growth Rate
The United States (US) Lavatory Service Vehicles Market was estimated at USD 222 Million in 2025 and is projected to reach USD 260 Million by 2032, growing at a CAGR of 2.3% from 2026 to 2032. This growth is primarily driven by the resurgence of air travel and increasing regulations surrounding hygiene and waste management. As airlines seek to enhance passenger experiences and comply with environmental standards, the demand for sophisticated lavatory service vehicles is becoming increasingly critical.
United States (US) Lavatory Service Vehicles Market Year-wise Growth Rate and Key Drivers
This graph highlights how the United States (US) Lavatory Service Vehicles Market has steadily grown over the years, supported by major growth factors.
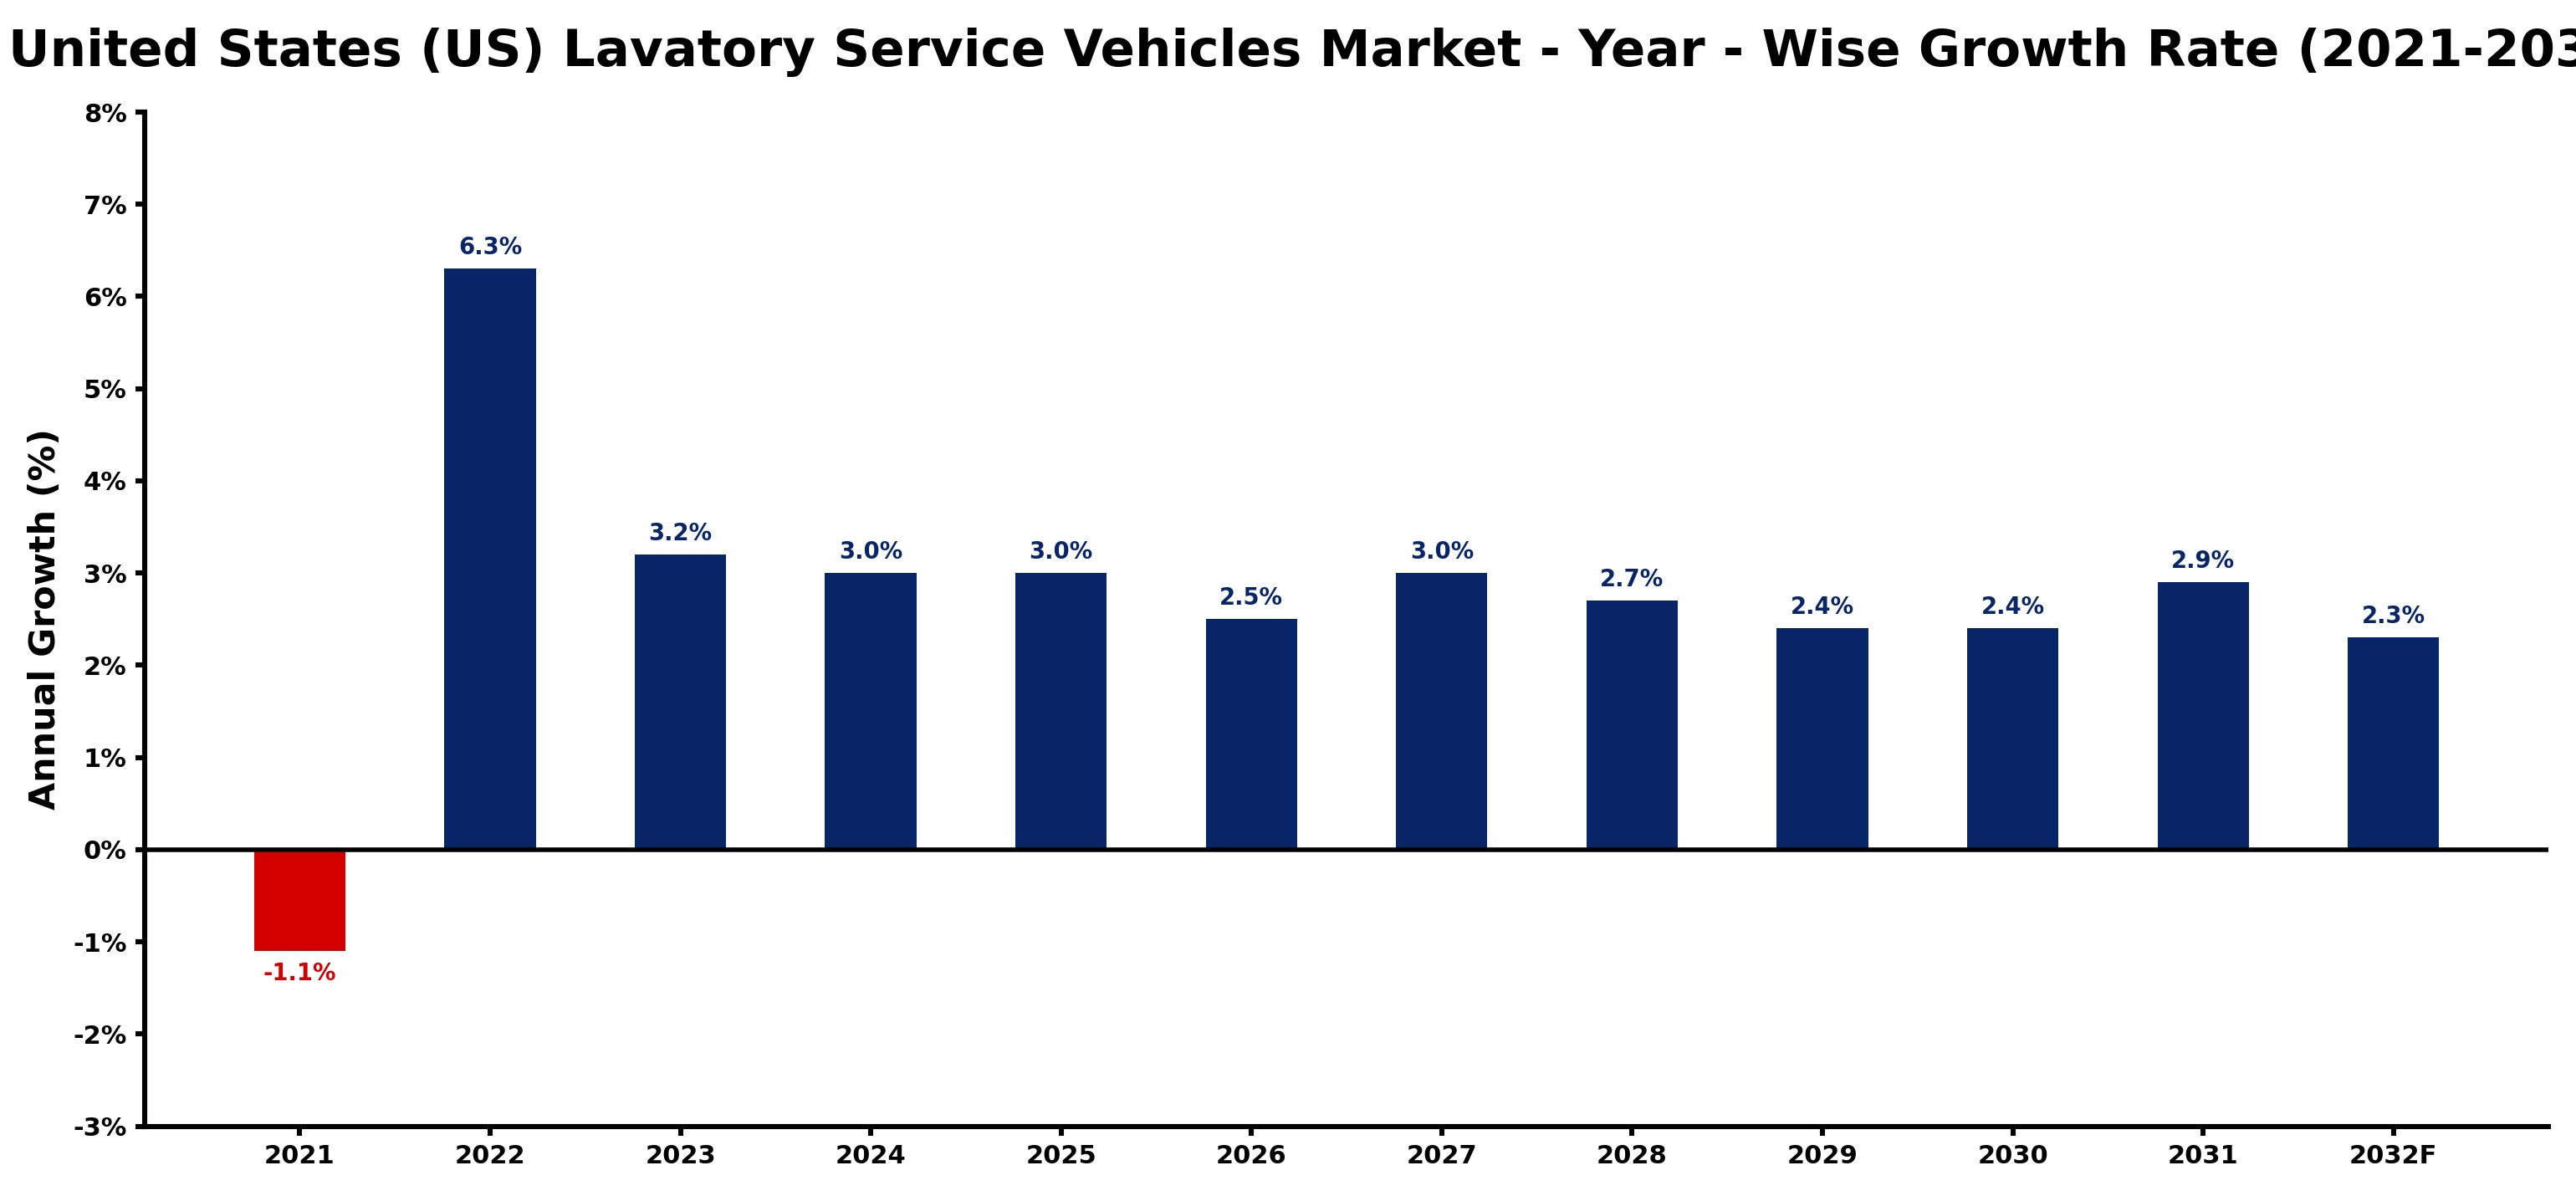
The table below presents the year‑wise growth rates along with the key drivers influencing the market
| Year | Growth Rate | Major Drivers |
| 2021 | -1.1% | Operational costs limited investments |
| 2022 | 6.3% | Increased airport traffic stimulated demand |
| 2023 | 3.2% | Regulatory changes enhanced compliance |
| 2024 | 3.0% | Fleet modernization improved efficiency |
| 2025 | 3.0% | Sustainability initiatives attracted interest |
| 2026 | 2.5% | Technological advancements optimized operations |
| 2027 | 3.0% | Service diversification expanded customer base |
| 2028 | 2.7% | Partnerships with airlines increased reach |
| 2029 | 2.4% | Enhanced safety standards drove upgrades |
| 2030 | 2.4% | Market consolidation improved service offerings |
| 2031 | 2.9% | Rising tourism boosted service needs |
| 2032 | 2.3% | Innovative designs attracted new clients |
Note - Market size estimations and growth projections presented in this report are based on 6Wresearch’s advanced forecasting approach, validated with industry datasets as of June 2026.
United States (US) Lavatory Service Vehicles Market Synopsis
The US lavatory service vehicles market is essential to the aviation industry, providing critical services to ensure aircraft lavatories are maintained to high hygiene standards. As passenger numbers rise, the need for efficient servicing of lavatory systems becomes paramount, creating a robust demand for advanced service vehicles.
Additionally, the market is witnessing a push towards electric and hybrid vehicles, driven by the need to meet stricter environmental regulations. As airport authorities and airlines focus on sustainability, innovations in vehicle technology are expected to play a significant role in shaping the future of lavatory service operations.
United States (US) Lavatory Service Vehicles Market Key Takeaways
- The market is poised for steady growth as air travel continues to rebound post-pandemic.
- Environmental sustainability is becoming a significant focus, leading to increased demand for eco-friendly service vehicles.
- Technological advancements, including automation and real-time monitoring, are reshaping operational efficiency.
- Regulatory compliance is crucial for service providers, impacting operational strategies and costs.
- Investment opportunities abound, particularly in fleet expansion and innovative waste management technologies.
Evaluation of Restraints in United States (US) Lavatory Service Vehicles Market
The US Lavatory Service Vehicles Market faces several key restraints that could hinder its growth. Increasing regulatory requirements surrounding waste disposal and environmental standards necessitate that service providers invest significantly in compliance, which can drive up operational costs. Furthermore, the maintenance of specialized equipment is crucial; failures or inefficiencies can lead to service delays and increased expenditures. The competitive landscape, characterized by a limited number of established players, poses challenges for new entrants trying to gain market share, adding an additional layer of complexity to the market dynamics.
United States (US) Lavatory Service Vehicles Market Trends
Current trends in the US lavatory service vehicles market indicate a strong shift towards sustainability, with manufacturers increasingly focusing on electric and hybrid vehicle solutions to lower carbon footprints. Moreover, the integration of smart technologies such as GPS tracking and automated waste removal systems is enhancing operational efficiency. These innovations are not just responding to regulatory demands but are also aiming to improve service speed and reliability, thereby contributing to overall passenger satisfaction.
United States (US) Lavatory Service Vehicles Market Opportunities
Investment opportunities within the US lavatory service vehicles market are plentiful as airports and airlines look to expand their fleets to accommodate growing passenger volumes. There is a notable demand for research and development focused on improving vehicle sustainability and efficiency. Additionally, technological advancements, particularly in real-time monitoring and automation, offer avenues for enhancing service quality and reducing operational costs, marking a promising landscape for potential investors.
Government Initiatives in the United States (US) Lavatory Service Vehicles Market
Government policies regarding the US lavatory service vehicles market center on enhancing safety and environmental sustainability. Regulatory bodies, such as the Environmental Protection Agency (EPA), enforce emissions standards applicable to vehicles operating in airport environments, thereby promoting greener practices. Additionally, the Occupational Safety and Health Administration (OSHA) establishes guidelines to protect the safety of workers in this sector. Such initiatives underline the importance of compliance and innovation in the market, as companies strive to align with evolving regulations.
Future Insights of the United States (US) Lavatory Service Vehicles Market
Looking ahead to 2026-2032, the US lavatory service vehicles market is set to expand in conjunction with the ongoing recovery of the aviation industry. An increase in passenger traffic and heightened focus on hygiene will drive demand for efficient waste management solutions. Furthermore, technological innovations, particularly around electrification and smart service features, are expected to redefine operational landscapes. As regulations become more stringent, companies embracing sustainability and advanced technology will be well-positioned for success in this evolving market.
United States (US) Lavatory Service Vehicles Market Latest Developments (May 2025 - June 2026)
Recent developments in the US lavatory service vehicles market illustrate a clear trajectory towards innovation and environmental responsibility. Many operators are starting to transition their fleets to include electric and hybrid models, aligning with both regulatory pressures and market expectations for sustainability. Moreover, enhancements in vehicle technology, such as improved automation for waste management, are increasingly being adopted, helping to streamline operations and reduce service times in bustling airport environments.
United States (US) Lavatory Service Vehicles Market - Key Attractiveness of the Report
- 10 Years of Market Numbers
- Historical Data Starting from 2022 to 2025
- Base Year: 2025
- Forecast Data until 2032
- Key Performance Indicators Impacting the Market
- Major Upcoming Developments and Projects
Key Highlights of the Report:
- United States (US) Lavatory Service Vehicles Market Outlook
- Market Size of United States (US) Lavatory Service Vehicles Market, 2025
- Forecast of United States (US) Lavatory Service Vehicles Market, 2032
- Historical Data and Forecast of United States (US) Lavatory Service Vehicles Revenues & Volume for the Period 2022-2032F
- United States (US) Lavatory Service Vehicles Market Trend Evolution
- United States (US) Lavatory Service Vehicles Market Drivers and Challenges
- United States (US) Lavatory Service Vehicles Price Trends
- United States (US) Lavatory Service Vehicles Porter's Five Forces
- United States (US) Lavatory Service Vehicles Industry Life Cycle
- Historical Data and Forecast of United States (US) Lavatory Service Vehicles Market Revenues & Volume By Power for the Period 2022-2032F
- Historical Data and Forecast of United States (US) Lavatory Service Vehicles Market Revenues & Volume By Electric for the Period 2022-2032F
- Historical Data and Forecast of United States (US) Lavatory Service Vehicles Market Revenues & Volume By Non-Electric for the Period 2022-2032F
- Historical Data and Forecast of United States (US) Lavatory Service Vehicles Market Revenues & Volume By Hybrid for the Period 2022-2032F
- Historical Data and Forecast of United States (US) Lavatory Service Vehicles Market Revenues & Volume By Capacity for the Period 2022-2032F
- Historical Data and Forecast of United States (US) Lavatory Service Vehicles Market Revenues & Volume By <50 gallons for the Period 2022-2032F
- Historical Data and Forecast of United States (US) Lavatory Service Vehicles Market Revenues & Volume By 50-100 gallons for the Period 2022-2032F
- Historical Data and Forecast of United States (US) Lavatory Service Vehicles Market Revenues & Volume By 101-200 gallons for the Period 2022-2032F
- Historical Data and Forecast of United States (US) Lavatory Service Vehicles Market Revenues & Volume By >200 gallons for the Period 2022-2032F
- Historical Data and Forecast of United States (US) Lavatory Service Vehicles Market Revenues & Volume By Vehicle for the Period 2022-2032F
- Historical Data and Forecast of United States (US) Lavatory Service Vehicles Market Revenues & Volume By Trucks for the Period 2022-2032F
- Historical Data and Forecast of United States (US) Lavatory Service Vehicles Market Revenues & Volume By Carts for the Period 2022-2032F
- Historical Data and Forecast of United States (US) Lavatory Service Vehicles Market Revenues & Volume By Application for the Period 2022-2032F
- Historical Data and Forecast of United States (US) Lavatory Service Vehicles Market Revenues & Volume By Commercial for the Period 2022-2032F
- Historical Data and Forecast of United States (US) Lavatory Service Vehicles Market Revenues & Volume By Defence for the Period 2022-2032F
- United States (US) Lavatory Service Vehicles Import Export Trade Statistics
- Market Opportunity Assessment By Power
- Market Opportunity Assessment By Capacity
- Market Opportunity Assessment By Vehicle
- Market Opportunity Assessment By Application
- United States (US) Lavatory Service Vehicles Top Companies Market Share
- United States (US) Lavatory Service Vehicles Competitive Benchmarking By Technical and Operational Parameters
- United States (US) Lavatory Service Vehicles Company Profiles
- United States (US) Lavatory Service Vehicles Key Strategic Recommendations
United States (US) Lavatory Service Vehicles Market - Frequently Asked Questions
The United States (US) Lavatory Service Vehicles Market is projected to grow from USD 222 Million in 2025 to USD 260 Million by 2032, with a CAGR of 2.3% from 2026 to 2032. This indicates a positive outlook for the sector as it adapts to increased demand and regulatory pressures.
The demand is primarily driven by the resurgence of air travel, stringent hygiene regulations, and the industry’s focus on sustainability. As more passengers travel, the need for efficient waste management solutions becomes even more critical.
Many companies are innovating towards electric and hybrid vehicles to reduce emissions and comply with environmental regulations. This shift not only meets regulatory requirements but also aligns with consumer expectations for sustainability.
Advancements such as automation, GPS tracking, and remote monitoring systems are revolutionizing operational efficiency. These technologies help streamline operations, improve service speed, and enhance overall reliability.
Regulatory policies set forth by agencies like the EPA and OSHA play a crucial role in shaping operational standards. Compliance with these regulations is essential for service providers, impacting their operational costs and the technologies they deploy.
6Wresearch actively monitors the United States (US) Lavatory Service Vehicles Market and publishes its comprehensive annual report, highlighting emerging trends, growth drivers, revenue analysis, and forecast outlook. Our insights help businesses to make data-backed strategic decisions with ongoing market dynamics. Our analysts track relevent industries related to the United States (US) Lavatory Service Vehicles Market, allowing our clients with actionable intelligence and reliable forecasts tailored to emerging regional needs.
Yes, we provide customisation as per your requirements. To learn more, feel free to contact us on sales@6wresearch.com
1 Executive Summary |
2 Introduction |
2.1 Key Highlights of the Report |
2.2 Report Description |
2.3 Market Scope & Segmentation |
2.4 Research Methodology |
2.5 Assumptions |
3 United States (US) Lavatory Service Vehicles Market Overview |
3.1 United States (US) Country Macro Economic Indicators |
3.2 United States (US) Lavatory Service Vehicles Market Revenues & Volume, 2022 & 2032F |
3.3 United States (US) Lavatory Service Vehicles Market - Industry Life Cycle |
3.4 United States (US) Lavatory Service Vehicles Market - Porter's Five Forces |
3.5 United States (US) Lavatory Service Vehicles Market Revenues & Volume Share, By Power, 2022 & 2032F |
3.6 United States (US) Lavatory Service Vehicles Market Revenues & Volume Share, By Capacity, 2022 & 2032F |
3.7 United States (US) Lavatory Service Vehicles Market Revenues & Volume Share, By Vehicle, 2022 & 2032F |
3.8 United States (US) Lavatory Service Vehicles Market Revenues & Volume Share, By Application, 2022 & 2032F |
4 United States (US) Lavatory Service Vehicles Market Dynamics |
4.1 Impact Analysis |
4.2 Market Drivers |
4.2.1 Increasing demand for air travel leading to higher requirement for lavatory service vehicles |
4.2.2 Stringent regulations and standards pushing airlines to maintain cleanliness and hygiene in aircraft lavatories |
4.2.3 Technological advancements in lavatory service vehicles leading to improved efficiency and performance |
4.3 Market Restraints |
4.3.1 High initial investment and maintenance costs for lavatory service vehicles |
4.3.2 Limited availability of skilled technicians for servicing and repairing lavatory service vehicles |
5 United States (US) Lavatory Service Vehicles Market Trends |
6 United States (US) Lavatory Service Vehicles Market, By Types |
6.1 United States (US) Lavatory Service Vehicles Market, By Power |
6.1.1 Overview and Analysis |
6.1.2 United States (US) Lavatory Service Vehicles Market Revenues & Volume, By Power, 2022-2032F |
6.1.3 United States (US) Lavatory Service Vehicles Market Revenues & Volume, By Electric, 2022-2032F |
6.1.4 United States (US) Lavatory Service Vehicles Market Revenues & Volume, By Non-Electric, 2022-2032F |
6.1.5 United States (US) Lavatory Service Vehicles Market Revenues & Volume, By Hybrid, 2022-2032F |
6.2 United States (US) Lavatory Service Vehicles Market, By Capacity |
6.2.1 Overview and Analysis |
6.2.2 United States (US) Lavatory Service Vehicles Market Revenues & Volume, By <50 gallons, 2022-2032F |
6.2.3 United States (US) Lavatory Service Vehicles Market Revenues & Volume, By 50-100 gallons, 2022-2032F |
6.2.4 United States (US) Lavatory Service Vehicles Market Revenues & Volume, By 101-200 gallons, 2022-2032F |
6.2.5 United States (US) Lavatory Service Vehicles Market Revenues & Volume, By >200 gallons, 2022-2032F |
6.3 United States (US) Lavatory Service Vehicles Market, By Vehicle |
6.3.1 Overview and Analysis |
6.3.2 United States (US) Lavatory Service Vehicles Market Revenues & Volume, By Trucks, 2022-2032F |
6.3.3 United States (US) Lavatory Service Vehicles Market Revenues & Volume, By Carts, 2022-2032F |
6.4 United States (US) Lavatory Service Vehicles Market, By Application |
6.4.1 Overview and Analysis |
6.4.2 United States (US) Lavatory Service Vehicles Market Revenues & Volume, By Commercial, 2022-2032F |
6.4.3 United States (US) Lavatory Service Vehicles Market Revenues & Volume, By Defence, 2022-2032F |
7 United States (US) Lavatory Service Vehicles Market Import-Export Trade Statistics |
7.1 United States (US) Lavatory Service Vehicles Market Export to Major Countries |
7.2 United States (US) Lavatory Service Vehicles Market Imports from Major Countries |
8 United States (US) Lavatory Service Vehicles Market Key Performance Indicators |
8.1 Average turnaround time for lavatory service at airports |
8.2 Percentage of airlines compliant with cleanliness standards for aircraft lavatories |
8.3 Adoption rate of advanced technologies in lavatory service vehicles |
9 United States (US) Lavatory Service Vehicles Market - Opportunity Assessment |
9.1 United States (US) Lavatory Service Vehicles Market Opportunity Assessment, By Power, 2022 & 2032F |
9.2 United States (US) Lavatory Service Vehicles Market Opportunity Assessment, By Capacity, 2022 & 2032F |
9.3 United States (US) Lavatory Service Vehicles Market Opportunity Assessment, By Vehicle, 2022 & 2032F |
9.4 United States (US) Lavatory Service Vehicles Market Opportunity Assessment, By Application, 2022 & 2032F |
10 United States (US) Lavatory Service Vehicles Market - Competitive Landscape |
10.1 United States (US) Lavatory Service Vehicles Market Revenue Share, By Companies, 2025 |
10.2 United States (US) Lavatory Service Vehicles Market Competitive Benchmarking, By Operating and Technical Parameters |
11 Company Profiles |
12 Recommendations |
13 Disclaimer |
Global Go To Market Strategy - 2030
Export potential enables firms to identify high-growth global markets with greater confidence by combining advanced trade intelligence with a structured quantitative methodology. The framework analyzes emerging demand trends and country-level import patterns while integrating macroeconomic and trade datasets such as GDP and population forecasts, bilateral import–export flows, tariff structures, elasticity differentials between developed and developing economies, geographic distance, and import demand projections. Using weighted trade values from 2020–2024 as the base period to project country-to-country export potential for 2030, these inputs are operationalized through calculated drivers such as gravity model parameters, tariff impact factors, and projected GDP per-capita growth. Through an analysis of hidden potentials, demand hotspots, and market conditions that are most favorable to success, this method enables firms to focus on target countries, maximize returns, and global expansion with data, backed by accuracy.
By factoring in the projected importer demand gap that is currently unmet and could be potential opportunity, it identifies the potential for the Exporter (Country) among 190 countries, against the general trade analysis, which identifies the biggest importer or exporter.
To discover high-growth global markets and optimize your business strategy:
Click Here
Pricing
- Single User License$ 1,995
- Department License$ 2,400
- Site License$ 3,120
- Global License$ 3,795

Leadership Perspectives from Industry Events
Search
Thought Leadership and Analyst Meet


Our Clients
6WResearch In News
- India Air Conditioner Market Set for Strong Rebound in 2026 After Weather-Led Correction and GST-Driven Recovery: 6Wresearch
- ADAS in India: How Automatic Emergency Braking, Blind Spot Detection & Driver Monitoring are Transforming Road Safety
- Doha a strategic location for EV manufacturing hub: IPA Qatar
- Demand for luxury TVs surging in the GCC, says Samsung
- Empowering Growth: The Thriving Journey of Bangladesh’s Cable Industry
- Demand for luxury TVs surging in the GCC, says Samsung
Latest Reports
- Nicaragua RPG Gaming Market (2026-2032)
- New Zealand RPG Gaming Market (2026-2032)
- Netherlands RPG Gaming Market (2026-2032)
- Nauru RPG Gaming Market (2026-2032)
- Namibia RPG Gaming Market (2026-2032)
- Mozambique RPG Gaming Market (2026-2032)
- Montenegro RPG Gaming Market (2026-2032)
- Mongolia RPG Gaming Market (2026-2032)
- Monaco RPG Gaming Market (2026-2032)
- Micronesia RPG Gaming Market (2026-2032)
Industry Events and Analyst Meet

EV India Expo 2026

HIMTEX 2026

India Refining Summit 2026

India EV Show 2026

EV tech India Expo 2026
Whitepaper
- Middle East & Africa Commercial Security Market Click here to view more.
- Middle East & Africa Fire Safety Systems & Equipment Market Click here to view more.
- GCC Drone Market Click here to view more.
- Middle East Lighting Fixture Market Click here to view more.
- GCC Physical & Perimeter Security Market Click here to view more.