United States (US) Smart Nanomaterials Market (2026-2032) Outlook | Analysis, Growth, Companies, Trends, Share, Value, Industry, Forecast, Revenue & Size
Market Forecast By Type (Metal-Based, Carbon Based, Polymeric, Others), By Industry Downstream (Pharmaceuticals, Electronics, Consumer Goods, Construction, Transportation, Others) And Competitive Landscape
| Product Code: ETC071960 | Publication Date: Jun 2021 | Updated Date: Jun 2026 | Product Type: Report | |
| Publisher: 6Wresearch | Author: Shubham Padhi | No. of Pages: 70 | No. of Figures: 35 | No. of Tables: 5 |
United States (US) Smart Nanomaterials Market Size, Share & Growth Rate
The United States (US) Smart Nanomaterials Market was estimated at USD 391 Million in 2025 and is projected to reach USD 513 Million by 2032, growing at a CAGR of 4.0% from 2026 to 2032. This growth is largely propelled by significant advancements in nanotechnology that enhance material efficiency and functionality, as well as increasing adoption across diverse sectors, including healthcare and electronics. In addition, government support for R&D is further driving innovation, fostering an environment ripe for the introduction of next-generation smart materials.
United States (US) Smart Nanomaterials Market Year-wise Growth Rate and Key Drivers
This graph highlights how the United States (US) Smart Nanomaterials Market has steadily grown over the years, supported by major growth factors.
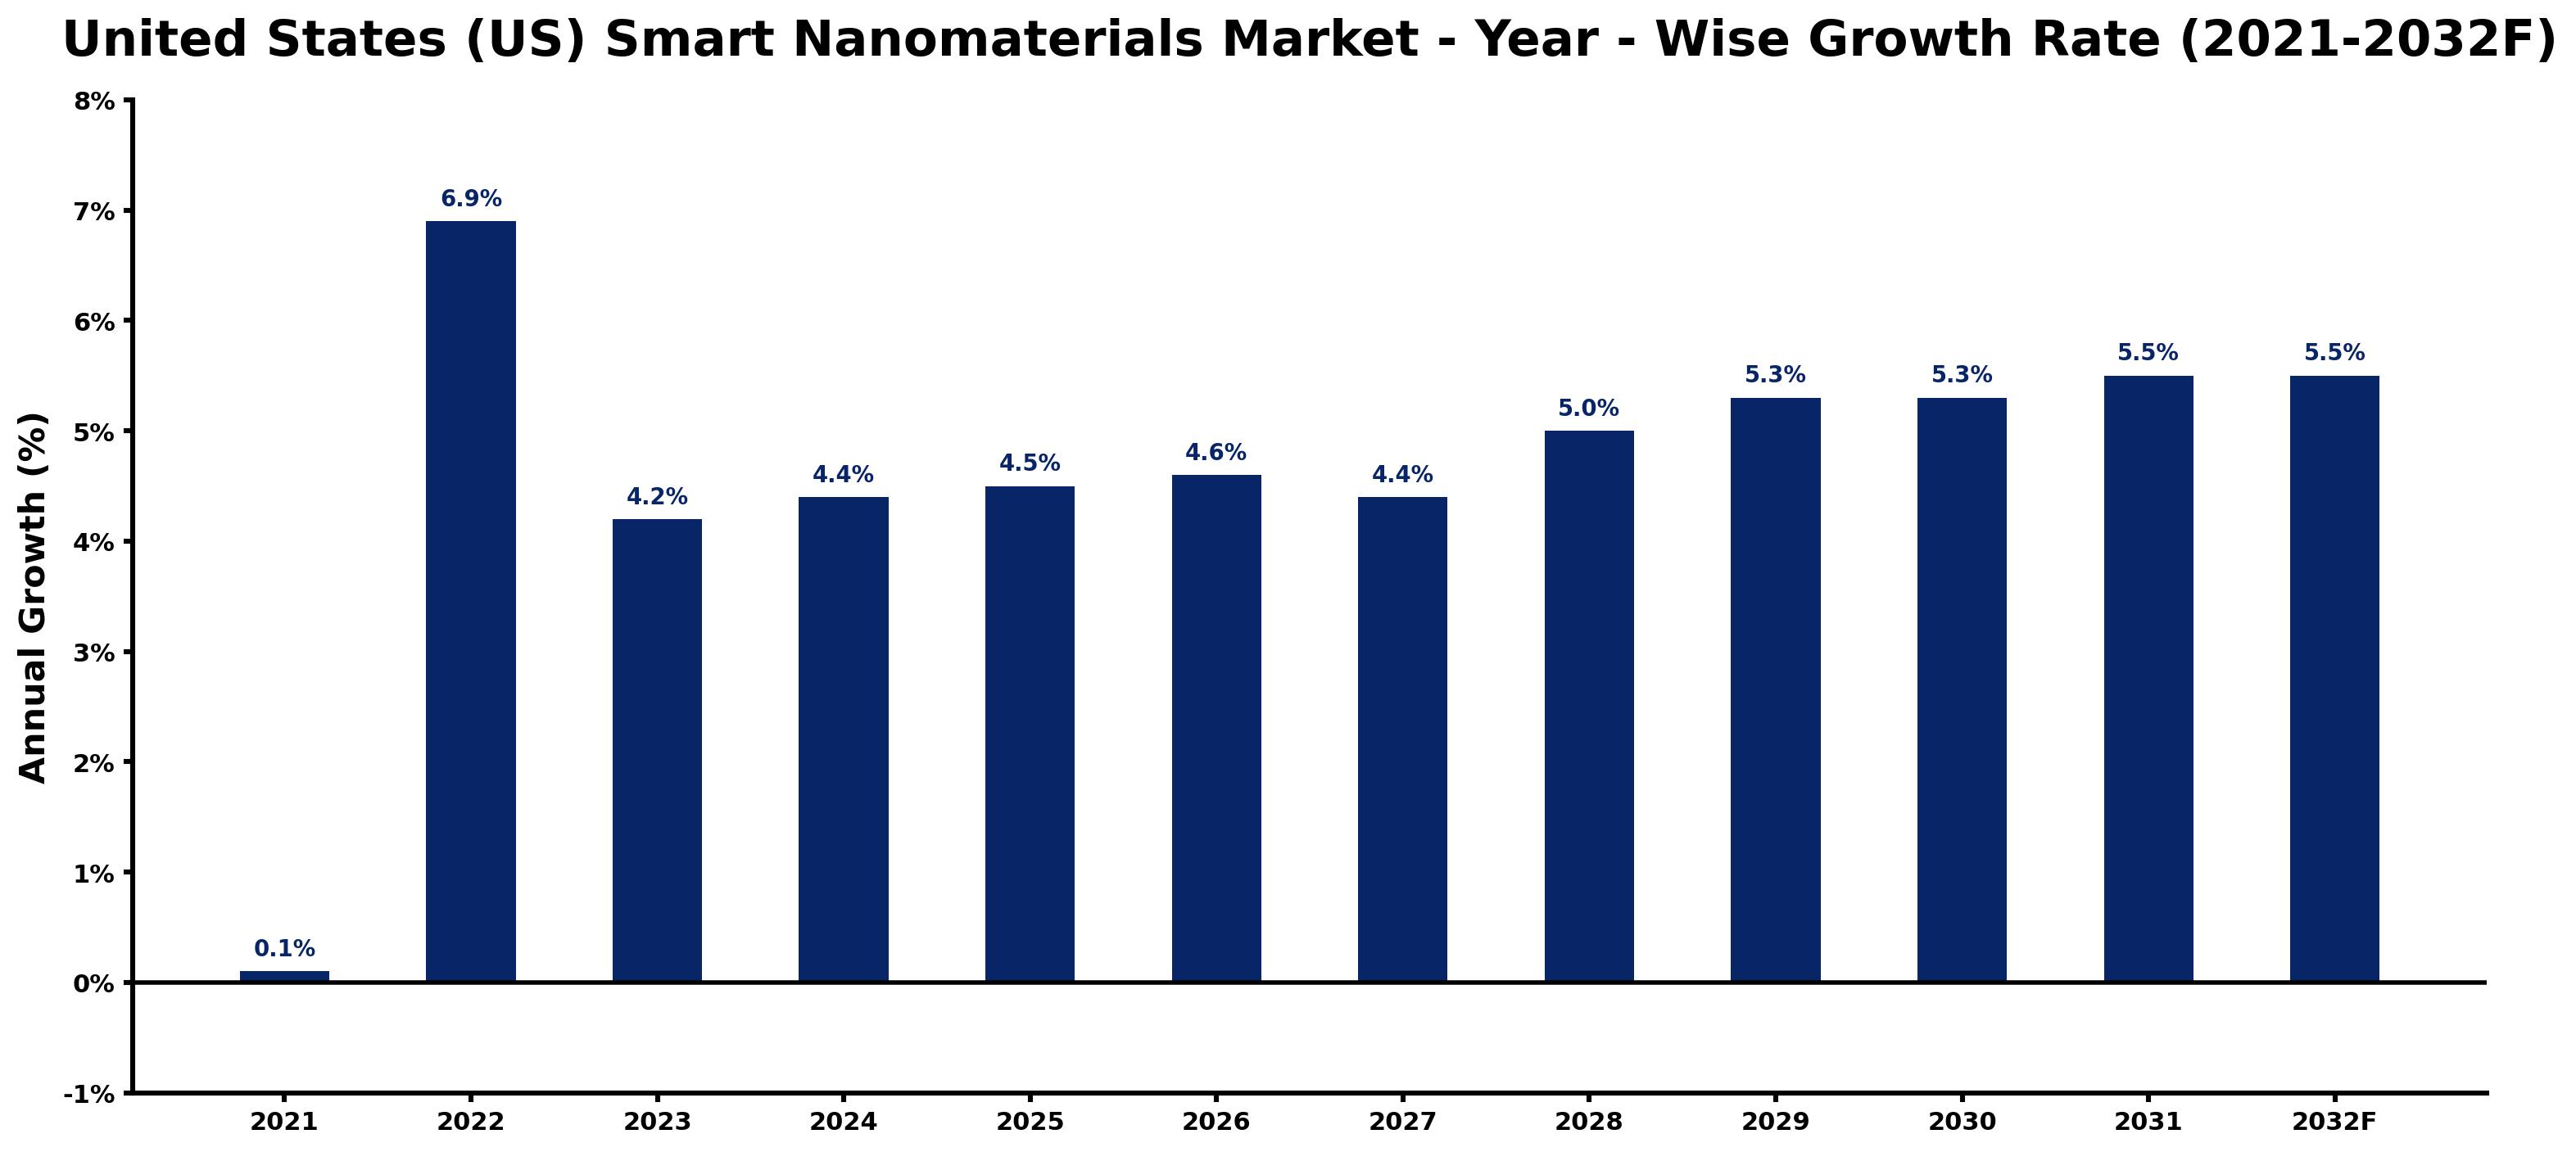
The table below presents the year‑wise growth rates along with the key drivers influencing the market
| Year | Growth Rate | Major Drivers |
| 2021 | 0.1% | Increasing industrial infrastructure investments |
| 2022 | 6.9% | Growing urbanization and commercial development |
| 2023 | 4.2% | Expansion of transportation and logistics networks |
| 2024 | 4.4% | Growing urbanization and commercial development |
| 2025 | 4.5% | Expansion of commercial construction activities |
| 2026 | 4.6% | Increasing industrial automation investments |
| 2027 | 4.4% | Increasing industrial infrastructure investments |
| 2028 | 5.0% | Increasing adoption of advanced technologies |
| 2029 | 5.3% | Growing renewable energy integration projects |
| 2030 | 5.3% | Increasing industrial infrastructure investments |
| 2031 | 5.5% | Increasing adoption of advanced technologies |
| 2032 | 5.5% | Expansion of commercial construction activities |
Note - Market size estimations and growth projections presented in this report are based on 6Wresearch’s advanced forecasting approach, validated with industry datasets as of June 2026.
United States (US) Smart Nanomaterials Market Synopsis
The US Smart Nanomaterials Market has seen recent momentum driven by burgeoning applications in various industries. As we look forward, the trajectory indicates a continued expansion fueled by ongoing technological developments and the increasing need for advanced materials that can respond to environmental stimuli.
In healthcare, for instance, smart nanomaterials are revolutionizing drug delivery methods and diagnostic imaging. Meanwhile, in electronics, these materials are enhancing device performance and energy efficiency. The convergence of research institutions and industries promises an innovative landscape, though navigating the associated regulatory challenges remains critical.
United States (US) Smart Nanomaterials Market Key Takeaways
- Market growth is primarily driven by advancements in nanotechnology and rising applications across multiple industries.
- Innovations in smart coatings and self-healing materials are emerging as key trends within the market.
- Sustainability concerns are prompting the development of eco-friendly smart nanomaterials.
- Collaboration among industry stakeholders, government, and academia is essential for overcoming existing market challenges.
- Investment opportunities are expanding in healthcare, electronics, and renewable energy sectors.
Evaluation of Restraints in United States (US) Smart Nanomaterials Market
Despite the optimistic outlook, the US Smart Nanomaterials Market grapples with several significant restraints. Regulatory hurdles, particularly surrounding the safety and environmental implications of nanomaterials, pose challenges for development and commercialization. Additionally, the high production costs and complexities of scaling up innovative materials can limit market potential. These barriers necessitate the establishment of standardized testing methods to ensure quality and consistency, as well as effective intellectual property protections to foster innovation without risk of infringement.
United States (US) Smart Nanomaterials Market Trends
The current landscape of the US Smart Nanomaterials Market is characterized by several emerging trends. The integration of nanotechnology in drug delivery systems and medical imaging is advancing rapidly, showcasing enhanced efficacy and precision. The development of smart coatings and self-healing materials is gaining traction, particularly in industries that prioritize durability and corrosion protection. Moreover, the environmental sustainability movement is driving the creation of biodegradable nanomaterials, appealing to eco-conscious consumers and regulatory bodies alike.
United States (US) Smart Nanomaterials Market Opportunities
Investment opportunities within the United States Smart Nanomaterials Market are abundant, particularly as demand escalates for high-performance materials. The healthcare sector stands out with its appetite for innovative solutions in drug delivery and diagnostics. Similarly, the electronics sector seeks advancements in device efficiency and miniaturization through nanomaterials. Furthermore, applications in renewable energy, such as improved solar cells and energy storage solutions, offer rich prospects for growth, making this market an attractive target for savvy investors.
Government Initiatives in the United States (US) Smart Nanomaterials Market
The US government plays a pivotal role in the development of the Smart Nanomaterials Market through various initiatives aimed at advancing nanotechnology. Agencies such as the National Nanotechnology Initiative (NNI) provide funding for research and development to stimulate innovation. Additionally, regulatory bodies like the Environmental Protection Agency (EPA) and the Food and Drug Administration (FDA) establish guidelines to ensure safe usage and disposal, enhancing public confidence. By promoting partnerships among academia, industry, and government, these initiatives help create an ecosystem conducive to the growth of smart nanomaterials.
Future Insights of the United States (US) Smart Nanomaterials Market
Looking ahead to 2026-2032, the United States Smart Nanomaterials Market is expected to witness substantial advancements across various sectors, including healthcare, electronics, and energy. The continuous demand for innovative materials that enhance product capabilities will drive further growth, supported by ongoing research initiatives. With an increasing focus on sustainable solutions, smart nanomaterials will likely play a critical role in meeting the needs of an evolving marketplace, ensuring robust opportunities for both existing and new market players.
United States (US) Smart Nanomaterials Market Latest Developments (May 2025 - June 2026)
Recent developments in the United States Smart Nanomaterials Market indicate a strong focus on collaboration between research institutions and industry leaders. Innovations in smart coatings and self-healing materials have gained traction, while efforts to streamline regulatory processes are underway to facilitate faster commercialization. Furthermore, there is increasing investment in projects aimed at enhancing the performance and sustainability of nanomaterials, as stakeholders aim to leverage these advancements for competitive advantage.
United States (US) Smart Nanomaterials Market - Key Attractiveness of the Report
- 10 Years of Market Numbers
- Historical Data Starting from 2022 to 2025
- Base Year: 2025
- Forecast Data until 2032
- Key Performance Indicators Impacting the Market
- Major Upcoming Developments and Projects
Key Highlights of the Report:
- United States (US) Smart Nanomaterials Market Outlook
- Market Size of United States (US) Smart Nanomaterials Market, 2025
- Forecast of United States (US) Smart Nanomaterials Market, 2032
- Historical Data and Forecast of United States (US) Smart Nanomaterials Revenues & Volume for the Period 2022-2032F
- United States (US) Smart Nanomaterials Market Trend Evolution
- United States (US) Smart Nanomaterials Market Drivers and Challenges
- United States (US) Smart Nanomaterials Price Trends
- United States (US) Smart Nanomaterials Porter's Five Forces
- United States (US) Smart Nanomaterials Industry Life Cycle
- Historical Data and Forecast of United States (US) Smart Nanomaterials Market Revenues & Volume By Type for the Period 2022-2032F
- Historical Data and Forecast of United States (US) Smart Nanomaterials Market Revenues & Volume By Metal-Based for the Period 2022-2032F
- Historical Data and Forecast of United States (US) Smart Nanomaterials Market Revenues & Volume By Carbon Based for the Period 2022-2032F
- Historical Data and Forecast of United States (US) Smart Nanomaterials Market Revenues & Volume By Polymeric for the Period 2022-2032F
- Historical Data and Forecast of United States (US) Smart Nanomaterials Market Revenues & Volume By Others for the Period 2022-2032F
- Historical Data and Forecast of United States (US) Smart Nanomaterials Market Revenues & Volume By Industry Downstream for the Period 2022-2032F
- Historical Data and Forecast of United States (US) Smart Nanomaterials Market Revenues & Volume By Pharmaceuticals for the Period 2022-2032F
- Historical Data and Forecast of United States (US) Smart Nanomaterials Market Revenues & Volume By Electronics for the Period 2022-2032F
- Historical Data and Forecast of United States (US) Smart Nanomaterials Market Revenues & Volume By Consumer Goods for the Period 2022-2032F
- Historical Data and Forecast of United States (US) Smart Nanomaterials Market Revenues & Volume By Construction for the Period 2022-2032F
- Historical Data and Forecast of United States (US) Smart Nanomaterials Market Revenues & Volume By Transportation for the Period 2022-2032F
- Historical Data and Forecast of United States (US) Smart Nanomaterials Market Revenues & Volume By Others for the Period 2022-2032F
- United States (US) Smart Nanomaterials Import Export Trade Statistics
- Market Opportunity Assessment By Type
- Market Opportunity Assessment By Industry Downstream
- United States (US) Smart Nanomaterials Top Companies Market Share
- United States (US) Smart Nanomaterials Competitive Benchmarking By Technical and Operational Parameters
- United States (US) Smart Nanomaterials Company Profiles
- United States (US) Smart Nanomaterials Key Strategic Recommendations
United States (US) Smart Nanomaterials Market - Frequently Asked Questions
Growth is primarily driven by advancements in nanotechnology and increasing demand across sectors like healthcare, electronics, and renewable energy.
The market is projected to reach USD 513 Million by 2032, reflecting a steady growth trajectory from an estimated USD 391 Million in 2025.
Yes, trends include the rising adoption of smart coatings, the development of eco-friendly materials, and innovative drug delivery systems in healthcare.
Businesses encounter challenges such as regulatory hurdles, high production costs, and the need for standardized testing methods to ensure product reliability.
Opportunities abound in healthcare, electronics, and renewable energy, particularly for companies focused on developing innovative and sustainable solutions.
Government initiatives, such as funding research and establishing safety guidelines, significantly enhance the growth potential by promoting innovation and ensuring public safety.
6Wresearch actively monitors the United States (US) Smart Nanomaterials Market and publishes its comprehensive annual report, highlighting emerging trends, growth drivers, revenue analysis, and forecast outlook. Our insights help businesses to make data-backed strategic decisions with ongoing market dynamics. Our analysts track relevent industries related to the United States (US) Smart Nanomaterials Market, allowing our clients with actionable intelligence and reliable forecasts tailored to emerging regional needs.
Yes, we provide customisation as per your requirements. To learn more, feel free to contact us on sales@6wresearch.com
1 Executive Summary |
2 Introduction |
2.1 Key Highlights of the Report |
2.2 Report Description |
2.3 Market Scope & Segmentation |
2.4 Research Methodology |
2.5 Assumptions |
3 United States (US) Smart Nanomaterials Market Overview |
3.1 United States (US) Country Macro Economic Indicators |
3.2 United States (US) Smart Nanomaterials Market Revenues & Volume, 2022 & 2032F |
3.3 United States (US) Smart Nanomaterials Market - Industry Life Cycle |
3.4 United States (US) Smart Nanomaterials Market - Porter's Five Forces |
3.5 United States (US) Smart Nanomaterials Market Revenues & Volume Share, By Type, 2022 & 2032F |
3.6 United States (US) Smart Nanomaterials Market Revenues & Volume Share, By Industry Downstream, 2022 & 2032F |
4 United States (US) Smart Nanomaterials Market Dynamics |
4.1 Impact Analysis |
4.2 Market Drivers |
4.2.1 Increasing demand for advanced materials in electronics, healthcare, and energy sectors |
4.2.2 Technological advancements leading to the development of innovative smart nanomaterials |
4.2.3 Growing investments in research and development activities related to nanotechnology |
4.3 Market Restraints |
4.3.1 High cost associated with the production and commercialization of smart nanomaterials |
4.3.2 Regulatory challenges and environmental concerns regarding the use of nanomaterials |
4.3.3 Limited awareness and understanding of the benefits of smart nanomaterials among end users |
5 United States (US) Smart Nanomaterials Market Trends |
6 United States (US) Smart Nanomaterials Market, By Types |
6.1 United States (US) Smart Nanomaterials Market, By Type |
6.1.1 Overview and Analysis |
6.1.2 United States (US) Smart Nanomaterials Market Revenues & Volume, By Type, 2022-2032F |
6.1.3 United States (US) Smart Nanomaterials Market Revenues & Volume, By Metal-Based, 2022-2032F |
6.1.4 United States (US) Smart Nanomaterials Market Revenues & Volume, By Carbon Based, 2022-2032F |
6.1.5 United States (US) Smart Nanomaterials Market Revenues & Volume, By Polymeric, 2022-2032F |
6.1.6 United States (US) Smart Nanomaterials Market Revenues & Volume, By Others, 2022-2032F |
6.2 United States (US) Smart Nanomaterials Market, By Industry Downstream |
6.2.1 Overview and Analysis |
6.2.2 United States (US) Smart Nanomaterials Market Revenues & Volume, By Pharmaceuticals, 2022-2032F |
6.2.3 United States (US) Smart Nanomaterials Market Revenues & Volume, By Electronics, 2022-2032F |
6.2.4 United States (US) Smart Nanomaterials Market Revenues & Volume, By Consumer Goods, 2022-2032F |
6.2.5 United States (US) Smart Nanomaterials Market Revenues & Volume, By Construction, 2022-2032F |
6.2.6 United States (US) Smart Nanomaterials Market Revenues & Volume, By Transportation, 2022-2032F |
6.2.7 United States (US) Smart Nanomaterials Market Revenues & Volume, By Others, 2022-2032F |
7 United States (US) Smart Nanomaterials Market Import-Export Trade Statistics |
7.1 United States (US) Smart Nanomaterials Market Export to Major Countries |
7.2 United States (US) Smart Nanomaterials Market Imports from Major Countries |
8 United States (US) Smart Nanomaterials Market Key Performance Indicators |
8.1 Research and development investments in smart nanomaterials technologies |
8.2 Number of patents filed or granted for smart nanomaterials applications |
8.3 Adoption rate of smart nanomaterials in key industries |
8.4 Number of partnerships and collaborations in the smart nanomaterials market |
8.5 Rate of technological advancements in the field of nanotechnology and smart materials |
9 United States (US) Smart Nanomaterials Market - Opportunity Assessment |
9.1 United States (US) Smart Nanomaterials Market Opportunity Assessment, By Type, 2022 & 2032F |
9.2 United States (US) Smart Nanomaterials Market Opportunity Assessment, By Industry Downstream, 2022 & 2032F |
10 United States (US) Smart Nanomaterials Market - Competitive Landscape |
10.1 United States (US) Smart Nanomaterials Market Revenue Share, By Companies, 2025 |
10.2 United States (US) Smart Nanomaterials Market Competitive Benchmarking, By Operating and Technical Parameters |
11 Company Profiles |
12 Recommendations |
13 Disclaimer |
Global Go To Market Strategy - 2030
Export potential enables firms to identify high-growth global markets with greater confidence by combining advanced trade intelligence with a structured quantitative methodology. The framework analyzes emerging demand trends and country-level import patterns while integrating macroeconomic and trade datasets such as GDP and population forecasts, bilateral import–export flows, tariff structures, elasticity differentials between developed and developing economies, geographic distance, and import demand projections. Using weighted trade values from 2020–2024 as the base period to project country-to-country export potential for 2030, these inputs are operationalized through calculated drivers such as gravity model parameters, tariff impact factors, and projected GDP per-capita growth. Through an analysis of hidden potentials, demand hotspots, and market conditions that are most favorable to success, this method enables firms to focus on target countries, maximize returns, and global expansion with data, backed by accuracy.
By factoring in the projected importer demand gap that is currently unmet and could be potential opportunity, it identifies the potential for the Exporter (Country) among 190 countries, against the general trade analysis, which identifies the biggest importer or exporter.
To discover high-growth global markets and optimize your business strategy:
Click Here
Pricing
- Single User License$ 1,995
- Department License$ 2,400
- Site License$ 3,120
- Global License$ 3,795

Leadership Perspectives from Industry Events
Search
Thought Leadership and Analyst Meet


Our Clients
6WResearch In News
- India Air Conditioner Market Set for Strong Rebound in 2026 After Weather-Led Correction and GST-Driven Recovery: 6Wresearch
- ADAS in India: How Automatic Emergency Braking, Blind Spot Detection & Driver Monitoring are Transforming Road Safety
- Doha a strategic location for EV manufacturing hub: IPA Qatar
- Demand for luxury TVs surging in the GCC, says Samsung
- Empowering Growth: The Thriving Journey of Bangladesh’s Cable Industry
- Demand for luxury TVs surging in the GCC, says Samsung
Latest Reports
- Nicaragua RPG Gaming Market (2026-2032)
- New Zealand RPG Gaming Market (2026-2032)
- Netherlands RPG Gaming Market (2026-2032)
- Nauru RPG Gaming Market (2026-2032)
- Namibia RPG Gaming Market (2026-2032)
- Mozambique RPG Gaming Market (2026-2032)
- Montenegro RPG Gaming Market (2026-2032)
- Mongolia RPG Gaming Market (2026-2032)
- Monaco RPG Gaming Market (2026-2032)
- Micronesia RPG Gaming Market (2026-2032)
Industry Events and Analyst Meet

EV India Expo 2026

HIMTEX 2026

India Refining Summit 2026

India EV Show 2026

EV tech India Expo 2026
Whitepaper
- Middle East & Africa Commercial Security Market Click here to view more.
- Middle East & Africa Fire Safety Systems & Equipment Market Click here to view more.
- GCC Drone Market Click here to view more.
- Middle East Lighting Fixture Market Click here to view more.
- GCC Physical & Perimeter Security Market Click here to view more.