Zambia Contact Lenses Market (2025-2031) | Trends, Size, Revenue, Forecast, Analysis, Outlook, Industry, Segmentation, Value, Companies, Share & Growth
Market Forecast By Material (Gas Permeable, Silicone Hydrogel, Hybrid), By Design (Spherical, Toric, Multifocal, Others), By Application (Corrective, Therapeutic, Cosmetic, Prosthetic, Lifestyle-oriented), By Distribution Channel (E-commerce, Eye Care Practitioners, Retail), By Usage (Daily Disposable, Disposable, Frequently Replacement, Traditional) And Competitive Landscape
| Product Code: ETC4662173 | Publication Date: Nov 2023 | Updated Date: Dec 2025 | Product Type: Market Research Report | |
| Publisher: 6Wresearch | Author: Shubham Padhi | No. of Pages: 60 | No. of Figures: 30 | No. of Tables: 5 |
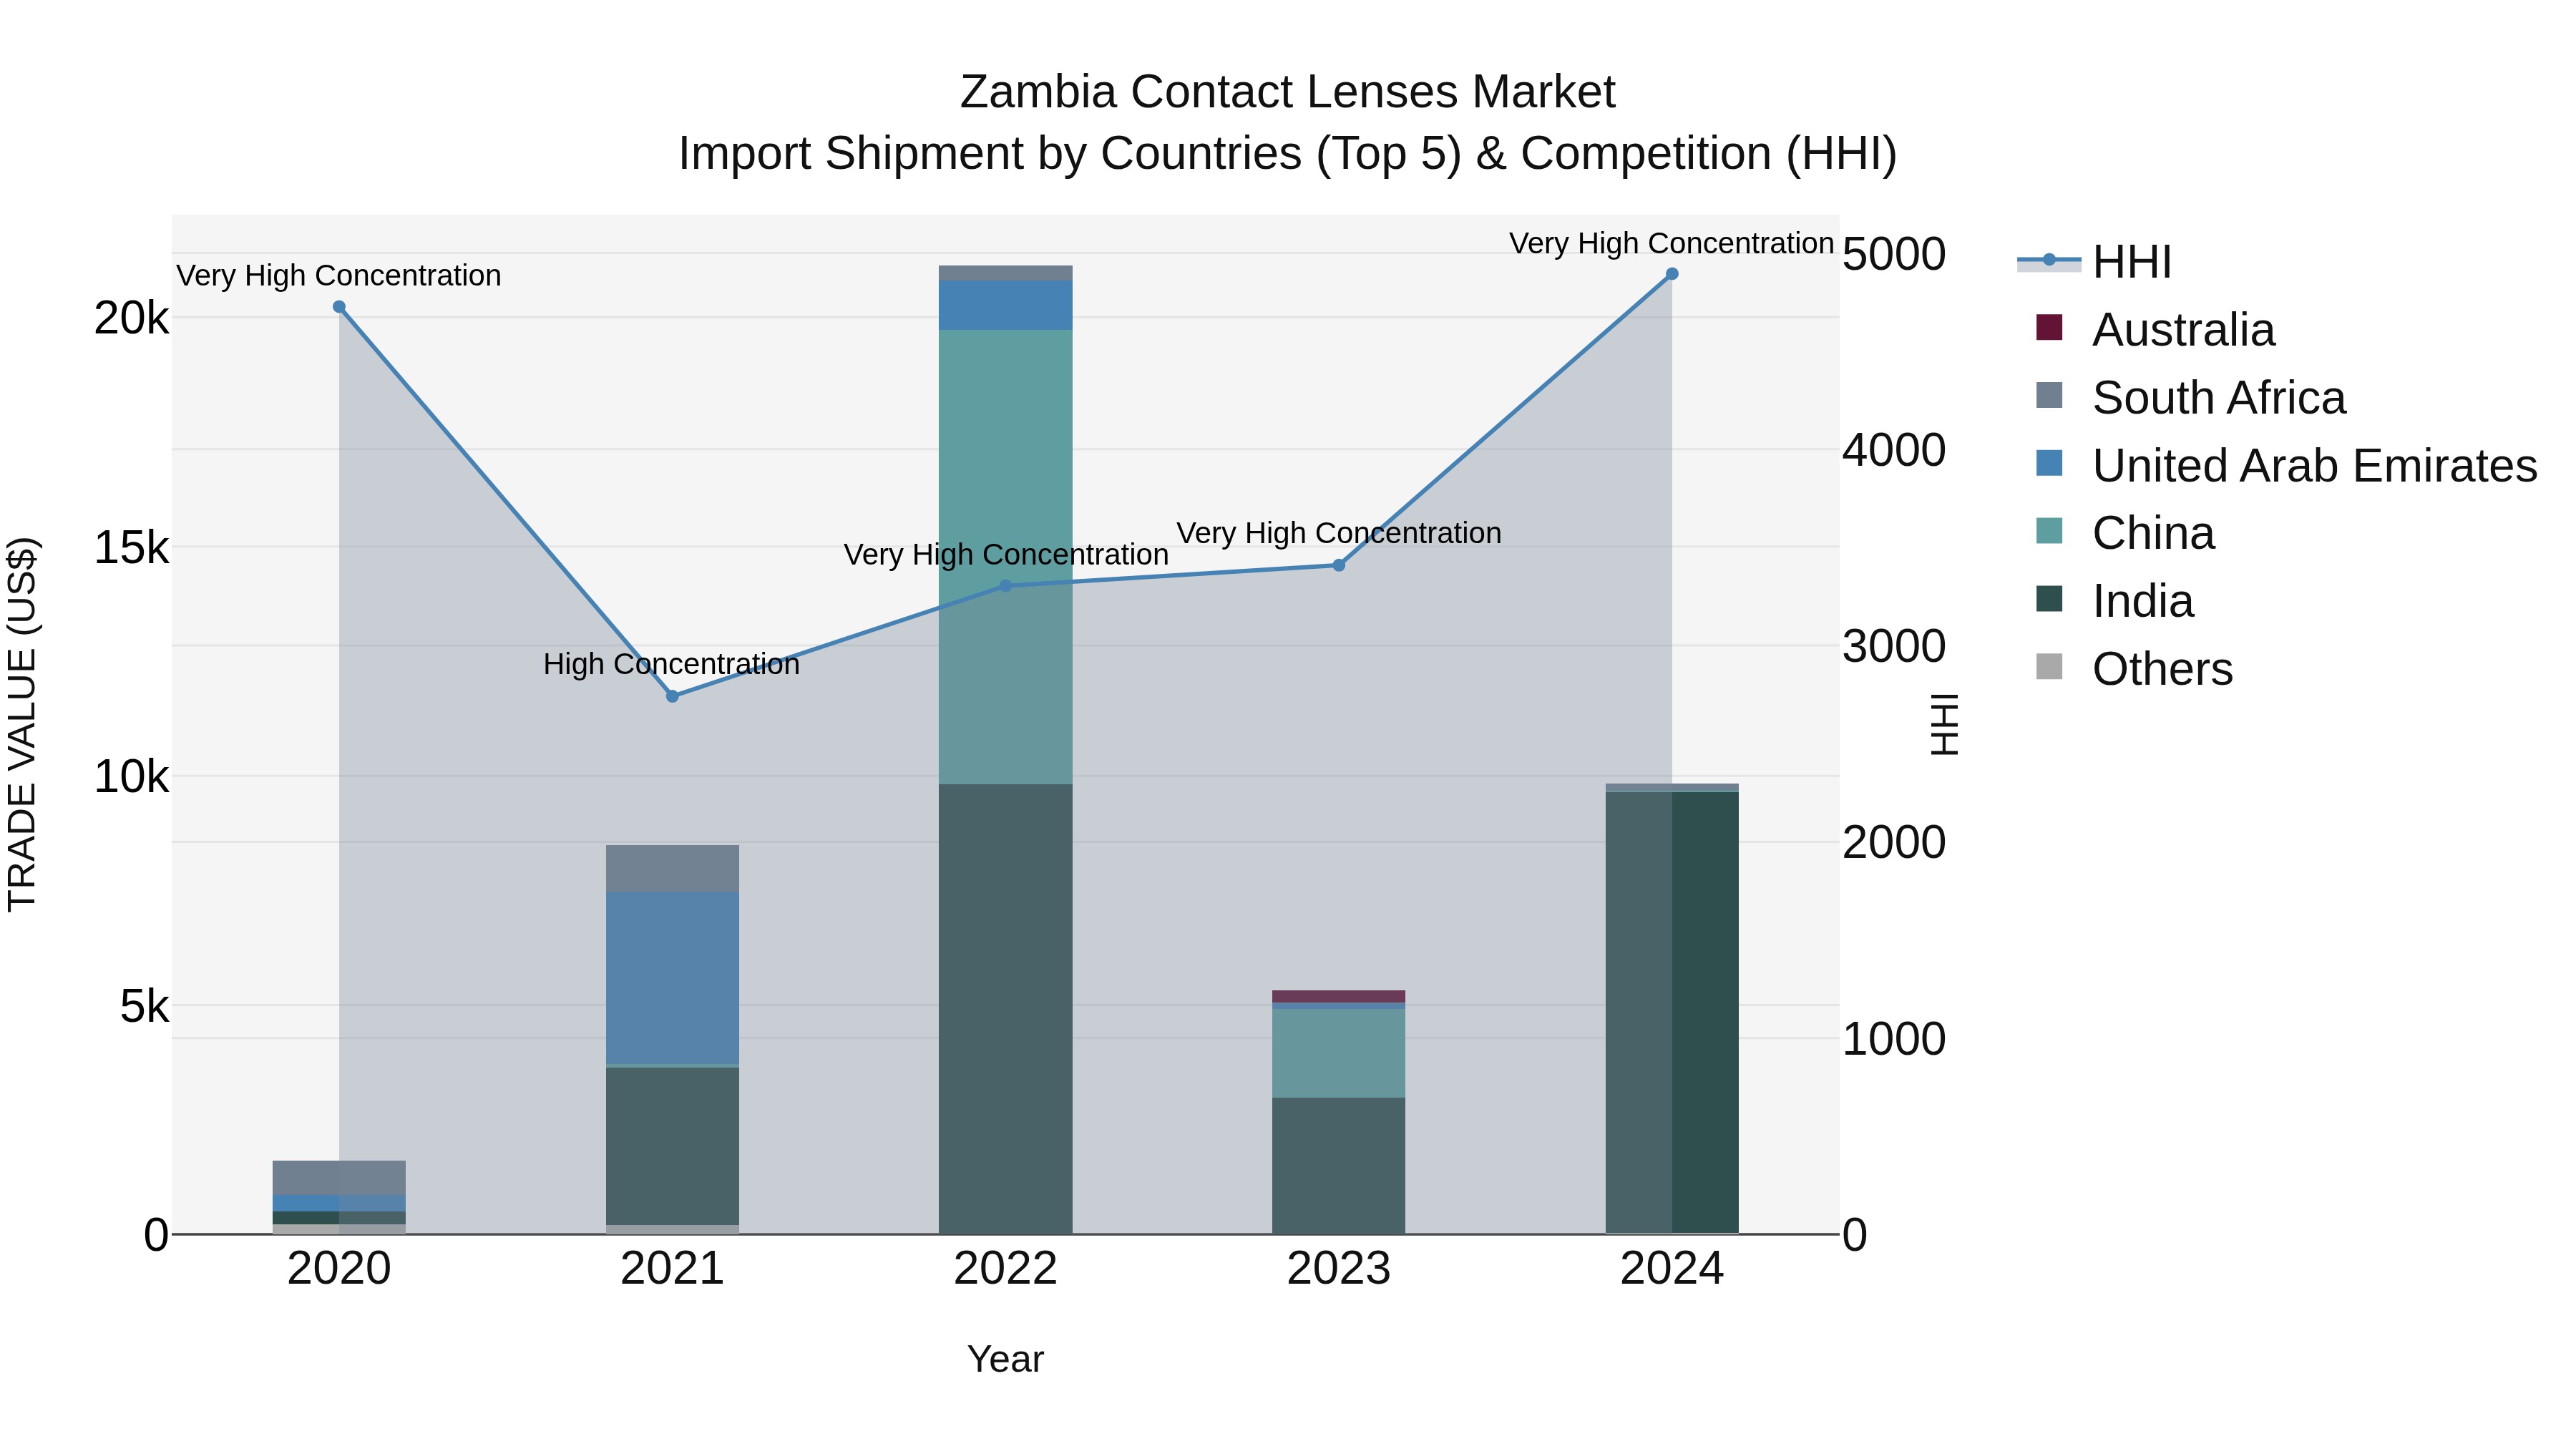
Zambia Contact Lenses Market: Top 5 Importing Countries and Market Competition (HHI) Analysis
The Zambia contact lenses import market saw significant growth in 2024, with top exporting countries including India, South Africa, China, USA, and Hong Kong. The market remains highly concentrated, as indicated by the high Herfindahl-Hirschman Index (HHI). The compound annual growth rate (CAGR) from 2020 to 2024 was an impressive 57.24%, with a notable growth rate of 84.77% from 2023 to 2024. These figures reflect a strong demand for contact lenses in Zambia and suggest a promising outlook for the industry.
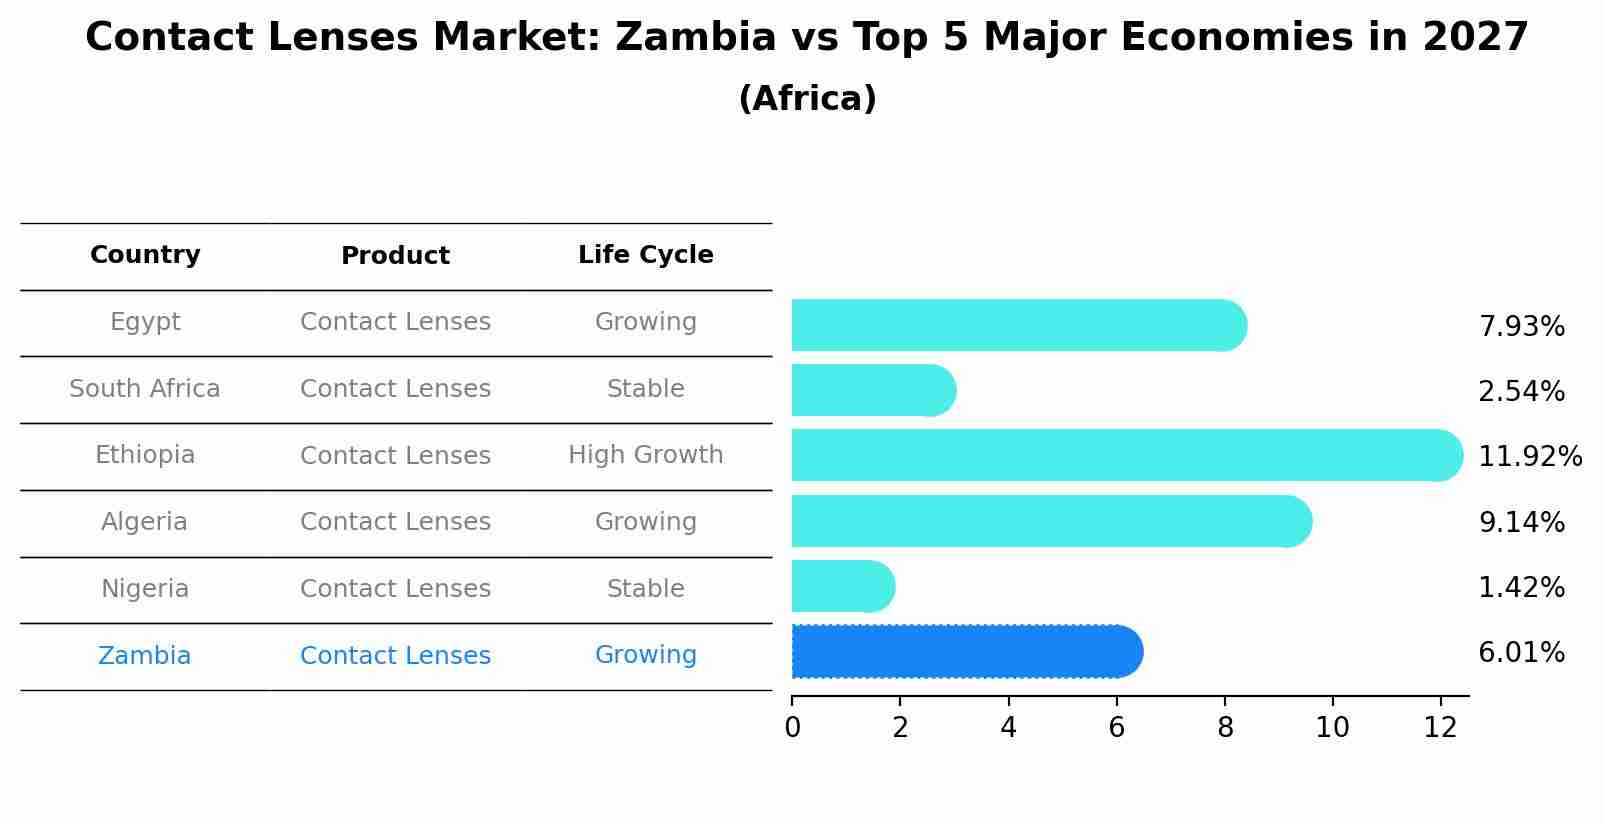
Contact Lenses Market: Zambia vs Top 5 Major Economies in 2027 (Africa)
Zambia's Contact Lenses market is anticipated to experience a growing growth rate of 6.01% by 2027, reflecting trends observed in the largest economy Egypt, followed by South Africa, Ethiopia, Algeria and Nigeria.
Key Highlights of the Report:
- Zambia Contact Lenses Market Outlook
- Market Size of Zambia Contact Lenses Market, 2024
- Forecast of Zambia Contact Lenses Market, 2031
- Historical Data and Forecast of Zambia Contact Lenses Revenues & Volume for the Period 2021-2031
- Zambia Contact Lenses Market Trend Evolution
- Zambia Contact Lenses Market Drivers and Challenges
- Zambia Contact Lenses Price Trends
- Zambia Contact Lenses Porter`s Five Forces
- Zambia Contact Lenses Industry Life Cycle
- Historical Data and Forecast of Zambia Contact Lenses Market Revenues & Volume By Material for the Period 2021-2031
- Historical Data and Forecast of Zambia Contact Lenses Market Revenues & Volume By Gas Permeable for the Period 2021-2031
- Historical Data and Forecast of Zambia Contact Lenses Market Revenues & Volume By Silicone Hydrogel for the Period 2021-2031
- Historical Data and Forecast of Zambia Contact Lenses Market Revenues & Volume By Hybrid for the Period 2021-2031
- Historical Data and Forecast of Zambia Contact Lenses Market Revenues & Volume By Design for the Period 2021-2031
- Historical Data and Forecast of Zambia Contact Lenses Market Revenues & Volume By Spherical for the Period 2021-2031
- Historical Data and Forecast of Zambia Contact Lenses Market Revenues & Volume By Toric for the Period 2021-2031
- Historical Data and Forecast of Zambia Contact Lenses Market Revenues & Volume By Multifocal for the Period 2021-2031
- Historical Data and Forecast of Zambia Contact Lenses Market Revenues & Volume By Others for the Period 2021-2031
- Historical Data and Forecast of Zambia Contact Lenses Market Revenues & Volume By Application for the Period 2021-2031
- Historical Data and Forecast of Zambia Contact Lenses Market Revenues & Volume By Corrective for the Period 2021-2031
- Historical Data and Forecast of Zambia Contact Lenses Market Revenues & Volume By Therapeutic for the Period 2021-2031
- Historical Data and Forecast of Zambia Contact Lenses Market Revenues & Volume By Cosmetic for the Period 2021-2031
- Historical Data and Forecast of Zambia Contact Lenses Market Revenues & Volume By Prosthetic for the Period 2021-2031
- Historical Data and Forecast of Zambia Contact Lenses Market Revenues & Volume By Lifestyle-oriented for the Period 2021-2031
- Historical Data and Forecast of Zambia Contact Lenses Market Revenues & Volume By Distribution Channel for the Period 2021-2031
- Historical Data and Forecast of Zambia Contact Lenses Market Revenues & Volume By E-commerce for the Period 2021-2031
- Historical Data and Forecast of Zambia Contact Lenses Market Revenues & Volume By Eye Care Practitioners for the Period 2021-2031
- Historical Data and Forecast of Zambia Contact Lenses Market Revenues & Volume By Retail for the Period 2021-2031
- Historical Data and Forecast of Zambia Contact Lenses Market Revenues & Volume By Usage for the Period 2021-2031
- Historical Data and Forecast of Zambia Contact Lenses Market Revenues & Volume By Daily Disposable for the Period 2021-2031
- Historical Data and Forecast of Zambia Contact Lenses Market Revenues & Volume By Disposable for the Period 2021-2031
- Historical Data and Forecast of Zambia Contact Lenses Market Revenues & Volume By Frequently Replacement for the Period 2021-2031
- Historical Data and Forecast of Zambia Contact Lenses Market Revenues & Volume By Traditional for the Period 2021-2031
- Zambia Contact Lenses Import Export Trade Statistics
- Market Opportunity Assessment By Material
- Market Opportunity Assessment By Design
- Market Opportunity Assessment By Application
- Market Opportunity Assessment By Distribution Channel
- Market Opportunity Assessment By Usage
- Zambia Contact Lenses Top Companies Market Share
- Zambia Contact Lenses Competitive Benchmarking By Technical and Operational Parameters
- Zambia Contact Lenses Company Profiles
- Zambia Contact Lenses Key Strategic Recommendations
Frequently Asked Questions About the Market Study (FAQs):
6Wresearch actively monitors the Zambia Contact Lenses Market and publishes its comprehensive annual report, highlighting emerging trends, growth drivers, revenue analysis, and forecast outlook. Our insights help businesses to make data-backed strategic decisions with ongoing market dynamics. Our analysts track relevent industries related to the Zambia Contact Lenses Market, allowing our clients with actionable intelligence and reliable forecasts tailored to emerging regional needs.
Yes, we provide customisation as per your requirements. To learn more, feel free to contact us on sales@6wresearch.com
1 Executive Summary |
2 Introduction |
2.1 Key Highlights of the Report |
2.2 Report Description |
2.3 Market Scope & Segmentation |
2.4 Research Methodology |
2.5 Assumptions |
3 Zambia Contact Lenses Market Overview |
3.1 Zambia Country Macro Economic Indicators |
3.2 Zambia Contact Lenses Market Revenues & Volume, 2021 & 2031F |
3.3 Zambia Contact Lenses Market - Industry Life Cycle |
3.4 Zambia Contact Lenses Market - Porter's Five Forces |
3.5 Zambia Contact Lenses Market Revenues & Volume Share, By Material, 2021 & 2031F |
3.6 Zambia Contact Lenses Market Revenues & Volume Share, By Design, 2021 & 2031F |
3.7 Zambia Contact Lenses Market Revenues & Volume Share, By Application, 2021 & 2031F |
3.8 Zambia Contact Lenses Market Revenues & Volume Share, By Distribution Channel, 2021 & 2031F |
3.9 Zambia Contact Lenses Market Revenues & Volume Share, By Usage, 2021 & 2031F |
4 Zambia Contact Lenses Market Dynamics |
4.1 Impact Analysis |
4.2 Market Drivers |
4.2.1 Increasing awareness about eye health and vision correction |
4.2.2 Growing prevalence of eye disorders and vision problems in Zambia |
4.2.3 Rise in disposable income leading to higher spending on healthcare products |
4.3 Market Restraints |
4.3.1 Lack of access to eye care services in remote areas of Zambia |
4.3.2 Limited availability of specialized eye care professionals |
4.3.3 Cultural barriers and stigma associated with wearing contact lenses in some communities |
5 Zambia Contact Lenses Market Trends |
6 Zambia Contact Lenses Market Segmentations |
6.1 Zambia Contact Lenses Market, By Material |
6.1.1 Overview and Analysis |
6.1.2 Zambia Contact Lenses Market Revenues & Volume, By Gas Permeable, 2021-2031F |
6.1.3 Zambia Contact Lenses Market Revenues & Volume, By Silicone Hydrogel, 2021-2031F |
6.1.4 Zambia Contact Lenses Market Revenues & Volume, By Hybrid, 2021-2031F |
6.2 Zambia Contact Lenses Market, By Design |
6.2.1 Overview and Analysis |
6.2.2 Zambia Contact Lenses Market Revenues & Volume, By Spherical, 2021-2031F |
6.2.3 Zambia Contact Lenses Market Revenues & Volume, By Toric, 2021-2031F |
6.2.4 Zambia Contact Lenses Market Revenues & Volume, By Multifocal, 2021-2031F |
6.2.5 Zambia Contact Lenses Market Revenues & Volume, By Others, 2021-2031F |
6.3 Zambia Contact Lenses Market, By Application |
6.3.1 Overview and Analysis |
6.3.2 Zambia Contact Lenses Market Revenues & Volume, By Corrective, 2021-2031F |
6.3.3 Zambia Contact Lenses Market Revenues & Volume, By Therapeutic, 2021-2031F |
6.3.4 Zambia Contact Lenses Market Revenues & Volume, By Cosmetic, 2021-2031F |
6.3.5 Zambia Contact Lenses Market Revenues & Volume, By Prosthetic, 2021-2031F |
6.3.6 Zambia Contact Lenses Market Revenues & Volume, By Lifestyle-oriented, 2021-2031F |
6.4 Zambia Contact Lenses Market, By Distribution Channel |
6.4.1 Overview and Analysis |
6.4.2 Zambia Contact Lenses Market Revenues & Volume, By E-commerce, 2021-2031F |
6.4.3 Zambia Contact Lenses Market Revenues & Volume, By Eye Care Practitioners, 2021-2031F |
6.4.4 Zambia Contact Lenses Market Revenues & Volume, By Retail, 2021-2031F |
6.5 Zambia Contact Lenses Market, By Usage |
6.5.1 Overview and Analysis |
6.5.2 Zambia Contact Lenses Market Revenues & Volume, By Daily Disposable, 2021-2031F |
6.5.3 Zambia Contact Lenses Market Revenues & Volume, By Disposable, 2021-2031F |
6.5.4 Zambia Contact Lenses Market Revenues & Volume, By Frequently Replacement, 2021-2031F |
6.5.5 Zambia Contact Lenses Market Revenues & Volume, By Traditional, 2021-2031F |
7 Zambia Contact Lenses Market Import-Export Trade Statistics |
7.1 Zambia Contact Lenses Market Export to Major Countries |
7.2 Zambia Contact Lenses Market Imports from Major Countries |
8 Zambia Contact Lenses Market Key Performance Indicators |
8.1 Number of eye health awareness campaigns conducted annually |
8.2 Percentage increase in the number of eye care professionals trained in fitting contact lenses |
8.3 Growth in the number of optical stores offering a wide range of contact lens options |
9 Zambia Contact Lenses Market - Opportunity Assessment |
9.1 Zambia Contact Lenses Market Opportunity Assessment, By Material, 2021 & 2031F |
9.2 Zambia Contact Lenses Market Opportunity Assessment, By Design, 2021 & 2031F |
9.3 Zambia Contact Lenses Market Opportunity Assessment, By Application, 2021 & 2031F |
9.4 Zambia Contact Lenses Market Opportunity Assessment, By Distribution Channel, 2021 & 2031F |
9.5 Zambia Contact Lenses Market Opportunity Assessment, By Usage, 2021 & 2031F |
10 Zambia Contact Lenses Market - Competitive Landscape |
10.1 Zambia Contact Lenses Market Revenue Share, By Companies, 2024 |
10.2 Zambia Contact Lenses Market Competitive Benchmarking, By Operating and Technical Parameters |
11 Company Profiles |
12 Recommendations | 13 Disclaimer |
Export potential assessment - trade Analytics for 2030
Export potential enables firms to identify high-growth global markets with greater confidence by combining advanced trade intelligence with a structured quantitative methodology. The framework analyzes emerging demand trends and country-level import patterns while integrating macroeconomic and trade datasets such as GDP and population forecasts, bilateral import–export flows, tariff structures, elasticity differentials between developed and developing economies, geographic distance, and import demand projections. Using weighted trade values from 2020–2024 as the base period to project country-to-country export potential for 2030, these inputs are operationalized through calculated drivers such as gravity model parameters, tariff impact factors, and projected GDP per-capita growth. Through an analysis of hidden potentials, demand hotspots, and market conditions that are most favorable to success, this method enables firms to focus on target countries, maximize returns, and global expansion with data, backed by accuracy.
By factoring in the projected importer demand gap that is currently unmet and could be potential opportunity, it identifies the potential for the Exporter (Country) among 190 countries, against the general trade analysis, which identifies the biggest importer or exporter.
To discover high-growth global markets and optimize your business strategy:
Click Here
Pricing
- Single User License$ 1,995
- Department License$ 2,400
- Site License$ 3,120
- Global License$ 3,795

Search
Thought Leadership and Analyst Meet


Our Clients
Latest Reports
- United Kingdom (UK) Long-term Care Insurance Market (2026-2032) | Growth, Share, Consumer Insights, Drivers, Opportunities, Competition, Pricing Analysis, Segments, Restraints, Companies, Competitive, Value, Outlook, Size, Demand, Analysis, Challenges, Strategic Insights, Investment Trends, Revenue, Trends, Supply, Forecast
- United Kingdom (UK) Long Term Care Market (2026-2032) | Companies, Outlook, Analysis, Trends, Value, Revenue, Segmentation, Share, Forecast, Competitive Landscape, Growth, Size & Forecast
- Iraq Insulation and Waterproofing Market (2026-2032) | Outlook, Drivers, Growth, Size, Share, Industry, Revenue, Trends, Demand, Competitive, Strategic Insights, Opportunities, Segments, Companies, Challenges, Strategy, Consumer Insights, Analysis, Investment Trends, Value, Segmentation, Forecast, Restraints
- India Switchgear Market Outlook (2026 - 2032) | Size, Share, Trends, Growth, Revenue, Forecast, Analysis, Value, Outlook
- Pakistan Contraceptive Implants Market (2025-2031) | Demand, Growth, Size, Share, Industry, Pricing Analysis, Competitive, Strategic Insights, Strategy, Consumer Insights, Analysis, Investment Trends, Opportunities, Revenue, Segments, Value, Segmentation, Supply, Forecast, Restraints, Outlook, Competition, Drivers, Trends, Companies, Challenges
- Sri Lanka Packaging Market (2026-2032) | Outlook, Competition, Drivers, Trends, Demand, Pricing Analysis, Competitive, Strategic Insights, Companies, Challenges, Strategy, Consumer Insights, Analysis, Investment Trends, Opportunities, Growth, Size, Share, Industry, Revenue, Segments, Value, Segmentation, Supply, Forecast, Restraints
- India Kids Watches Market (2026-2032) | Strategy, Consumer Insights, Analysis, Investment Trends, Opportunities, Growth, Size, Share, Industry, Revenue, Segments, Value, Segmentation, Supply, Forecast, Restraints, Outlook, Competition, Drivers, Trends, Demand, Pricing Analysis, Competitive, Strategic Insights, Companies, Challenges
- Saudi Arabia Core Assurance Service Market (2025-2031) | Strategy, Consumer Insights, Analysis, Investment Trends, Opportunities, Growth, Size, Share, Industry, Revenue, Segments, Value, Segmentation, Supply, Forecast, Restraints, Outlook, Competition, Drivers, Trends, Demand, Pricing Analysis, Competitive, Strategic Insights, Companies, Challenges
- Romania Uninterruptible Power Supply (UPS) Market (2026-2032) | Industry, Analysis, Revenue, Size, Forecast, Outlook, Value, Trends, Share, Growth & Companies
- Saudi Arabia Car Window Tinting Film, Paint Protection Film (PPF), and Ceramic Coating Market (2025-2031) | Strategy, Consumer Insights, Analysis, Investment Trends, Opportunities, Growth, Size, Share, Industry, Revenue, Segments, Value, Segmentation, Supply, Forecast, Restraints, Outlook, Competition, Drivers, Trends, Demand, Pricing Analysis, Competitive, Strategic Insights, Companies, Challenges
Industry Events and Analyst Meet

India EV Show 2026

EV tech India Expo 2026

Auto Tech Asia 2026

Battery Tech India 2026

Smart Production Solutions Guangzhou 2026
Whitepaper
- Middle East & Africa Commercial Security Market Click here to view more.
- Middle East & Africa Fire Safety Systems & Equipment Market Click here to view more.
- GCC Drone Market Click here to view more.
- Middle East Lighting Fixture Market Click here to view more.
- GCC Physical & Perimeter Security Market Click here to view more.
6WResearch In News
- Doha a strategic location for EV manufacturing hub: IPA Qatar
- Demand for luxury TVs surging in the GCC, says Samsung
- Empowering Growth: The Thriving Journey of Bangladesh’s Cable Industry
- Demand for luxury TVs surging in the GCC, says Samsung
- Video call with a traditional healer? Once unthinkable, it’s now common in South Africa
- Intelligent Buildings To Smooth GCC’s Path To Net Zero