Middle East Automated Fare Collection System Market (2018-2024) | Outlook, Companies, Value, Industry, Revenue, Trends, Growth, Share, Forecast, Analysis & Size
Market Forecast By AFC Technology (Near-Field Communication, Magnetic Strips & Tokens, and Smart Cards), By Applications (Metro Railway (Ticket Vending Machine (TVM), Ticket Office Machine (TOM), Fare Gates, Smart Card Ticketing, Central Computer, and Station Infrastructure), Bus Transport, Parking Solution and Others), By Countries (Saudi Arabia, Turkey, UAE, and Qatar) and Competitive Landscape
| Product Code: ETC000513 | Publication Date: Aug 2018 | Product Type: Report | ||
| Publisher: 6Wresearch | Author: Ravi Bhandari | No. of Pages: 119 | No. of Figures: 67 | No. of Tables: 7 |
Rise in a number of commercial vehicles, growing urbanization, and rising need for faster payment process owing to the increasing number of daily travelers/commuters, are some of the key factors that led to the overall growth in are some of the key factors that led to the overall growth in Automated Fare Collection System market of Middle East. Additionally, with the international event's venues in the middle region, would result in an increase in tourism in the country leading to further surge in demand for improved public transportation system resulting in a surge in deployment of are some of the key factors that led to the overall growth in Automated Fare Collection System in the region. Metro railway application system accounted for a major share of market revenues owing to the high prices of the complete AFC system at the stations.
Replacing the traditional ticketing systems with automated ticketing, automated fare collection is an end-to-end solution for collecting fare payments that consist of ticket vending machines, automatic gate machines, recharging terminals, and ticket checking machines. automated fare collection system reduces the time searching for the cash to buy tickets as well as waiting in the queues.
According to 6Wresearch, Middle East Automated Fare Collection System market size is projected to reach $12.5 billion by 2024. The market is expected to register a fluctuating growth over the period of next five years owing to the different completion period of construction projects in the countries in the middle east region. The Middle East has recorded multiple infrastructural development projects in the region due to the increasing tourism in the region.
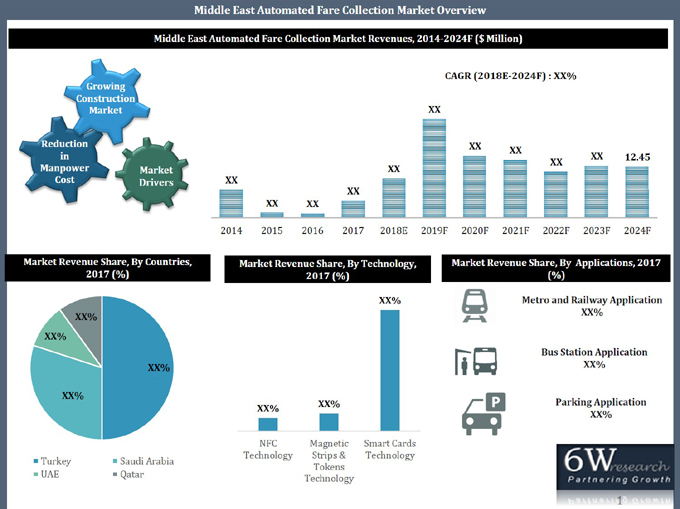
In the Middle East, Turkey held the major share in Middle East Automated Fare Collection System Market Share in terms of revenues on the back of the completion of the metro construction project in 2017, Saudi Arabia market is expected to generate maximum revenues during the forecast period due to increase in public transportation development projects in the country to promote tourism.The Middle East Automated Fare Collection System Market Report thoroughly covers the market by Automated Fare Collection System by technology, applications, and countries. The Middle East Automated Fare Collection System Market Outlook report provides an unbiased and detailed analysis of the Middle East Automated Fare Collection System Market Trends, opportunities/high growth areas, market drivers, which would help stakeholders to the device and align market strategies according to the current and future market dynamics.
The Middle East automated fare collection system market is expected to be triggered on the back of the growth of the transportation sector across the Middle East region. Technical upgradations in the transport industry in the Middle Eastern countries, rising adopted benefits of replacing the paper printed tickets with electronic tickets, contactless smart card application system, prevention of illegal generation and manipulation of data are, further, some of the potential drivers of the Middle East automated fare collection system market and would spur the growth of the market in the coming years. Rising need for solutions that allow congestion-free traffic and reduce environmental pollution along with better accessibility and better features of the automated fare collection system module are, further, some of the factors which would instigate significant revenues for the automated fare collection system market in across the Middle East region six years down the line.
Key Highlights of the Report:
• Middle East Automated Fare Collection System Market Overview
• Middle East Automated Fare Collection System Market Outlook
• Middle East Automated Fare Collection System Market Forecast
• Middle East Automated Fare Collection System Market Size and Middle East Automated Fare Collection System Market Forecast until 2024
• Historical Data of Middle East Automated Fare Collection System Market for the Period 2014-2017.
• Market Size & Forecast of Middle East Automated Fare Collection System Market until 2024
• Historical Data of Saudi Arabia Automated Fare Collection System Market for the Period 2014-2017.
• Market Size & Forecast of Saudi Arabia Automated Fare Collection System Market until 2024
• Historical Data of Qatar Automated Fare Collection System Market for the Period 2014-2017.
• Market Size & Forecast of Qatar Automated Fare Collection System Market until 2024
• Historical Data of UAE Automated Fare Collection System Market for the Period 2014-2017.
• Market Size & Forecast of UAE Automated Fare Collection System Market until 2024
• Historical Data of Turkey Automated Fare Collection System Market for the Period 2014-2017.
• Market Size & Forecast of Turkey Automated Fare Collection System Market until 2024
• Historic data of the Rest of Middle East Automated Fare Collection System Market Revenues 2014-2017.
• Market Size & Forecast of Rest of Middle East Automated Fare Collection System Market Revenues until 2024.
• Market Drivers and Restraints
• Middle East Automated Fare Collection System Market Trends
• Middle East Automated Fare Collection System Market Share by players and the Middle East Automated Fare Collection System Market Overview on Competitive Benchmarking
• Company Profiles
• Strategic Recommendations
Markets Covered
The Middle East Automated Fare Collection System Market Report provides detailed analysis of the following market segments:
• By AFC Technology
o Near-Field Communication
o Magnetic Strips & Tokens
o Smart Cards
• By Applications
o Metro Railway
?Ticket Vending Machine (TVM)
?Ticket Office Machine (TOM)
?Fare Gates
?Smart Card Ticketing
?Central Computer
?Station Infrastructure
o Bus Transport
o Parking Solution
o Others
• By Countries
o Saudi Arabia
o Turkey
o UAE
o Qatar
Other Key Available Reports Include:
• Saudi Arabia Automated Fare Collection System Market
• UAE Automated Fare Collection System Market
• Qatar Automated Fare Collection System Market
• Turkey Automated Fare Collection System Market
• India Automated Fare Collection System Market
Frequently Asked Questions About the Market Study (FAQs):
6Wresearch actively monitors the Middle East Automated Fare Collection System Market and publishes its comprehensive annual report, highlighting emerging trends, growth drivers, revenue analysis, and forecast outlook. Our insights help businesses to make data-backed strategic decisions with ongoing market dynamics. Our analysts track relevent industries related to the Middle East Automated Fare Collection System Market, allowing our clients with actionable intelligence and reliable forecasts tailored to emerging regional needs.
Yes, we provide customisation as per your requirements. To learn more, feel free to contact us on sales@6wresearch.com
 1. Executive Summary
2 Introduction
2.1 Key Highlights of the Report
2.2 Report Description
2.3 Market Scope & Segmentation
2.4 Assumptions & Methodology
3 Middle East Automated Fare Collection Systems Market Overview
3.1 Middle East Automated Fare Collection Systems Market Revenues (2014-2024F)
3.2 Middle East Automated Fare Collection Systems Market, Industry Life Cycle
3.3 Middle East Automated Fare Collection Systems Market, Porter's Five Forces Model
3.4 Middle East Automated Fare Collection Systems Market Revenue Share, By Regions (2017 & 2024F)
4 Middle East Automated Fare Collection Systems Market Dynamics
4.1 Impact Analysis
4.2 Market Drivers
4.3 Market Restraints
5 Middle East Automated Fare Collection Systems Market Trends
6 Turkey Automated Fare Collection Systems Market Overview
6.1 Turkey Automated Fare Collection Systems Market Revenues (2014-2024F)
6.2 Turkey Automated Fare Collection Systems Market Opportunity Matrix
6.3 Turkey Automated Fare Collection Systems Application Market Overview
6.3.1 Turkey Metro Railway Automated Fare Collection Systems Market Revenues, 2014-2024F
6.3.1.1 Turkey Metro Railway Hardware Automated Fare Collection Systems Market Revenues,
By Segments, 2014-2024F
6.3.2 Turkey Bus Transportation Automated Fare Collection Systems Market Revenues, 2014-2024F
6.3.3 Turkey Parking System Automated Fare Collection Systems Market Revenues, 2014-2024F
6.3.4 Turkey Other Application Automated Fare Collection Systems Market Revenues, 2014-2024F
6.4 Turkey Automated Fare Collection Systems Market Technology Overview
6.4.1 Turkey Automated Fare Collection Systems Market Revenues, By NFC Technology, 2014-2024F
6.4.2 Turkey Automated Fare Collection Systems Market Revenues,
By Magnetic Strips & Tokens Technology, 2014-2024F
6.4.3 Turkey Automated Fare Collection Systems Market Revenues, By Smart Cards Technology, 2014-2024F
7 Saudi Arabia Automated Fare Collection Systems Market Overview
7.1 Saudi Arabia Automated Fare Collection Systems Market Revenues (2014-2024F)
7.2 Saudi Arabia Automated Fare Collection Systems Market Opportunity Matrix
7.3 Saudi Arabia Automated Fare Collection Systems Application Market Overview
7.3.1 Saudi Arabia Metro Railway Automated Fare Collection Systems Market Revenues, 2014-2024F
7.3.1.1 Saudi Arabia Metro Railway Hardware Automated Fare Collection Systems Market Revenues,
By Segments, 2014-2024F
7.3.2 Saudi Arabia Bus Transportation Automated Fare Collection Systems Market Revenues, 2014-2024F
7.3.3 Saudi Arabia Parking System Automated Fare Collection Systems Market Revenues, 2014-2024F
7.3.4 Saudi Arabia Other Application Automated Fare Collection Systems Market Revenues, 2014-2024F
7.4 Saudi Arabia Automated Fare Collection Systems Market Technology Overview
7.4.1 Saudi Arabia Automated Fare Collection Systems Market Revenues, By NFC Technology, 2014-2024F
7.4.2 Saudi Arabia Automated Fare Collection Systems Market Revenues,
By Magnetic Strips & Tokens Technology, 2014-2024F
7.4.3 Saudi Arabia Automated Fare Collection Systems Market Revenues,
By Smart Cards Technology, 2014-2024F
8 UAE Automated Fare Collection Systems Market Overview
8.1 UAE Automated Fare Collection Systems Market Revenues (2014-2024F)
8.2 UAE Automated Fare Collection Systems Market Opportunity Matrix
8.3 UAE Automated Fare Collection Systems Application Market Overview
8.3.1 UAE Metro Railway Automated Fare Collection Systems Market Revenues, 2014-2024F
8.3.2 UAE Bus Transportation Automated Fare Collection Systems Market Revenues, 2014-2024F
8.3.3 UAE Parking System Automated Fare Collection Systems Market Revenues, 2014-2024F
8.3.4 UAE Other Application Automated Fare Collection Systems Market Revenues, 2014-2024F
8.4 UAE Automated Fare Collection Systems Market Technology Overview
8.4.1 UAE Automated Fare Collection Systems Market Revenues, By NFC Technology, 2014-2024F
8.4.2 UAE Automated Fare Collection Systems Market Revenues,
By Magnetic Strips & Tokens Technology, 2014-2024F
8.4.3 UAE Automated Fare Collection Systems Market Revenues, By Smart Cards Technology, 2014-2024F
9 Qatar Automated Fare Collection Systems Market Overview
9.1 Qatar Automated Fare Collection Systems Market Revenues (2014-2024F)
9.2 Qatar Automated Fare Collection Systems Market Opportunity Matrix
9.3 Qatar Automated Fare Collection Systems Application Market Overview
9.3.1 Qatar Metro Railway Automated Fare Collection Systems Market Revenues, 2014-2024F
9.3.2 Qatar Bus Transportation Automated Fare Collection Systems Market Revenues, 2014-2024F
9.3.3 Qatar Parking System Automated Fare Collection Systems Market Revenues, 2014-2024F
9.3.4 Qatar Other Application Automated Fare Collection Systems Market Revenues, 2014-2024F
9.4 Qatar Automated Fare Collection Systems Market Technology Overview
9.4.1 Qatar Automated Fare Collection Systems Market Revenues, By NFC Technology, 2014-2024F
9.4.2 Qatar Automated Fare Collection Systems Market Revenues,
By Magnetic Strips & Tokens Technology, 2014-2024F
9.4.3 Qatar Automated Fare Collection Systems Market Revenues, By Smart Cards Technology, 2014-2024F
10 Company Profiles
10.1 Indra Sistemas, SA
10.2 Hanwha Techwin Co Ltd
10.3 Thales S.A.
10.4 Xerox Corporation
11 Strategic Pointers
12 Disclaimer
List of Figures
Figure 1 Middle East Automated Fare Collection System Market Revenues, 2014-2024F ($ Billion)
Figure 2 Middle East Automated Annual GDP Growth, By Countries, 2014-2023F (%)
Figure 3 Middle East Automated Fare Collection System Market Revenue Share, By Region (2017 & 2024F)
Figure 4 Net Value of Projects Share in GCC, By Sector (2017)
Figure 5 Net Value of Projects Share in GCC, By Countries (2017)
Figure 6 Turkey Automated Fare Collection System Market Revenues, 2014-2024F ($ Billion)
Figure 7 Gross Domestic Product, at Current Prices of Turkey, 2014-2023F ($ Billion)
Figure 8 Turkish Lira to US Dollar Exchange Rate, Quarterly Currency Exchange Trend (Q1' 2014-Q4' 2017)
Figure 9 Turkey Automated Fare Collection System Market Opportunity Matrix, By Applications (2024F)
Figure 10 Turkey Metro Railway Automated Fare Collection System Market Revenues, 2014-2024F ($ Billion)
Figure 11 New Biletmatik Machines and Turnstiles Installed in Metro and Railway Stations in Istanbul,
2016-2019F (Units)
Figure 12 Average number of Metro and Railway Station to be Constructed in a year, 2014-2024F
Figure 13 Turkey Bus Transportation Automated Fare Collection System Market Revenues, 2014-2024F ($ Million)
Figure 14 Turkey on Road Buses Fleet Size, 2012-2018E (Thousand Buses)
Figure 15 Turkey Parking System Automated Fare Collection System Market Revenues, 2014-2024F ($ Million)
Figure 16 Turkey Other Application Automated Fare Collection System Market Revenues, 2014-2024F ($ Million)
Figure 17 Turkey Automated Fare Collection System Market Revenues, By NFC Technology, 2014-2024F ($ Million)
Figure 18 Turkey AFC System Market Revenue Share, By NFC Technology (2017 and 2024F)
Figure 19 Turkey Automated Fare Collection System Market Revenues, By Magnetic Strips & Tokens Technology,
2014-2024F ($ Million)
Figure 20 Turkey AFC System Market Revenue Share, By Magnetic Strips & Tokens Technology (2017 and 2024F)
Figure 21 Turkey Automated Fare Collection System Market Revenues, By Smart Cards Technology,
2014-2024F ($ Million)
Figure 22 Turkey AFC System Market Revenue Share, By Smart Cards Technology (2017 and 2024F)
Figure 23 Number of active Instanbulkarts, By Types, 2015-2017 (Million units)
Figure 24 Saudi Arabia Automated Fare Collection System Market Revenues, 2014-2024F ($ Billion)
Figure 25 Saudi Arabia Urban Population (% of Total Population), 2010-2017
Figure 26 Saudi Arabia Population, By Resident, 2014-2019F (Million)
Figure 27 Gross Domestic Product, at Current Prices of Saudi Arabia, 2014-2023F ($ Billion)
Figure 28 Saudi Arabia Automated Fare Collection System Market Opportunity Matrix, By Technology (2024F)
Figure 29 Saudi Arabia Metro Railway Automated Fare Collection System Market Revenues, 2014-2024F ($ Billion)
Figure 30 Saudi Arabia AFC System Market Revenue Share, By Metro Railway Application (2017 and 2024F)
Figure 31 Saudi Arabia Bus Transportation Automated Fare Collection System Market Revenues,
2014-2024F ($ Million)
Figure 32 Saudi Arabia AFC System Market Revenue Share, By Bus Transportation Application (2017 and 2024F)
Figure 33 Saudi Arabia Parking System Automated Fare Collection System Market Revenues, 2014-2024F ($ Million)
Figure 34 Saudi Arabia Other Application Automated Fare Collection System Market Revenues, 2014-2024F ($ Million)
Figure 35 Saudi Arabia Automated Fare Collection System Market Revenues, By NFC Technology,
2014-2024F ($ Million)
Figure 36 Saudi Arabia Automated Fare Collection System Market Revenues, By Magnetic Strips & Tokens Technology,
2014-2024F ($ Million)
Figure 37 Saudi Arabia Automated Fare Collection System Market Revenues, By Smart Cards Technology,
2014-2024F ($ Million)
Figure 38 UAE Automated Fare Collection System Market Revenues, 2014-2024F ($ Million)
Figure 39 Gross Domestic Product, at Current Prices of UAE, 2014-2023F ($ Billion)
Figure 40 UAE Automated Fare Collection System Market Opportunity Matrix, By Technology (2024F)
Figure 41 UAE Metro Railway Automated Fare Collection System Market Revenues, 2014-2024F ($ Million)
Figure 42 UAE Bus Transportation Automated Fare Collection System Market Revenues, 2014-2024F ($ Million)
Figure 43 Dubai Bus Fleet Size, 2015-2017 (Units)
Figure 44 UAE Parking System Automated Fare Collection System Market Revenues, 2014-2024F ($ Million)
Figure 45 UAE Other Application Automated Fare Collection System Market Revenues, 2014-2024F ($ Million)
Figure 46 UAE Automated Fare Collection System Market Revenues, By NFC Technology, 2014-2024F ($ Million)
Figure 47 UAE AFC System Market Revenue Share, By NFC Technology (2017 and 2024F)
Figure 48 UAE Automated Fare Collection System Market Revenues, By Magnetic Strips & Tokens Technology,
2014-2024F ($ Million)
Figure 49 UAE AFC System Market Revenue Share, By Magnetic Strips & Tokens Technology (2017 and 2024F)
Figure 50 UAE Automated Fare Collection System Market Revenues, By Smart Cards Technology,
2014-2024F ($ Million)
Figure 51 UAE AFC System Market Revenue Share, By Smart Cards Technology (2017 and 2024F)
Figure 52 Qatar Automated Fare Collection System Market Revenues, 2014-2024F ($ Million)
Figure 53 Gross Domestic Product, at Current Prices of Qatar, 2014-2023F ($ Billion)
Figure 54 Percentage of Urban Population, 2013- 2016 (% of Total Population)
Figure 55 Qatar Automated Fare Collection System Market Opportunity Matrix, By Technology (2024F)
Figure 56 Qatar Metro Railway Automated Fare Collection System Market Revenues, 2014-2024F ($ Million)
Figure 57 Average number of Metro and Railway Station Constructed in a year, 2014-2024F
Figure 58 Qatar Bus Transportation Automated Fare Collection System Market Revenues, 2014-2024F ($ Million)
Figure 59 Qatar Parking System Automated Fare Collection System Market Revenues, 2014-2024F ($ Million)
Figure 60 Qatar Other Application Automated Fare Collection System Market Revenues, 2014-2024F ($ Million)
Figure 61 Qatar Automated Fare Collection System Market Revenues, By NFC Technology, 2014-2024F ($ Million)
Figure 62 Qatar AFC System Market Revenue Share, NFC Technology (2017 and 2024F)
Figure 63 Qatar Automated Fare Collection System Market Revenues, By Magnetic Strips & Tokens Technology,
2014-2024F ($ Million)
Figure 64 Qatar AFC System Market Revenue Share, By Magnetic Strips & Tokens Technology (2017 and 2024F)
Figure 65 Qatar Automated Fare Collection System Market Revenues, By Smart Cards Technology,
2014-2024F ($ Million)
Figure 66 Qatar AFC System Market Revenue Share, By Smart Cards Technology (2017 and 2024F)
Figure 67 Qatar Public Transportation Passenger Fare Collection Smart Card System Planned
List of Tables
Table 1 Turkey Metro Railway Automated Fare Collection System Market Revenues,
By Segments 2014-2024F ($ Million)
Table 2 Saudi Arabia Metro Railway Automated Fare Collection System Market Revenues,
By Segments 2014-2024F ($ Million)
Table 3 Dubai Number of Metro Passengers on Red Lines, By Stations 2015-2017 (Million Passengers)
Table 4 Dubai Number of Metro Passengers on Green Lines, By Stations 2015-2017 (Million Passengers)
Table 5 Dubai Number of Bus Passengers, By Months 2015-2017 (Million Passengers)
Table 6 Upcoming Construction Projects in Dubai
Table 7 Different Types of Smart Cards Present In UAE
Global Go To Market Strategy - 2030
Export potential enables firms to identify high-growth global markets with greater confidence by combining advanced trade intelligence with a structured quantitative methodology. The framework analyzes emerging demand trends and country-level import patterns while integrating macroeconomic and trade datasets such as GDP and population forecasts, bilateral import–export flows, tariff structures, elasticity differentials between developed and developing economies, geographic distance, and import demand projections. Using weighted trade values from 2020–2024 as the base period to project country-to-country export potential for 2030, these inputs are operationalized through calculated drivers such as gravity model parameters, tariff impact factors, and projected GDP per-capita growth. Through an analysis of hidden potentials, demand hotspots, and market conditions that are most favorable to success, this method enables firms to focus on target countries, maximize returns, and global expansion with data, backed by accuracy.
By factoring in the projected importer demand gap that is currently unmet and could be potential opportunity, it identifies the potential for the Exporter (Country) among 190 countries, against the general trade analysis, which identifies the biggest importer or exporter.
To discover high-growth global markets and optimize your business strategy:
Click Here
Pricing
- Single User License$ 4,560
- Department License$ 5,055
- Site License$ 5,595
- Global License$ 6,000

Leadership Perspectives from Industry Events
Search
Thought Leadership and Analyst Meet


Our Clients
6WResearch In News
- India Export Attractiveness Tracker 2026
- India Air Conditioner Market Set for Strong Rebound in 2026 After Weather-Led Correction and GST-Driven Recovery: 6Wresearch
- ADAS in India: How Automatic Emergency Braking, Blind Spot Detection & Driver Monitoring are Transforming Road Safety
- Doha a strategic location for EV manufacturing hub: IPA Qatar
- Demand for luxury TVs surging in the GCC, says Samsung
- Empowering Growth: The Thriving Journey of Bangladesh’s Cable Industry
Latest Reports
- Nicaragua RPG Gaming Market (2026-2032)
- New Zealand RPG Gaming Market (2026-2032)
- Netherlands RPG Gaming Market (2026-2032)
- Nauru RPG Gaming Market (2026-2032)
- Namibia RPG Gaming Market (2026-2032)
- Mozambique RPG Gaming Market (2026-2032)
- Montenegro RPG Gaming Market (2026-2032)
- Mongolia RPG Gaming Market (2026-2032)
- Monaco RPG Gaming Market (2026-2032)
- Micronesia RPG Gaming Market (2026-2032)
Industry Events and Analyst Meet

EV India Expo 2026

HIMTEX 2026

India Refining Summit 2026

India EV Show 2026

EV tech India Expo 2026
Whitepaper
- Middle East & Africa Commercial Security Market Click here to view more.
- Middle East & Africa Fire Safety Systems & Equipment Market Click here to view more.
- GCC Drone Market Click here to view more.
- Middle East Lighting Fixture Market Click here to view more.
- GCC Physical & Perimeter Security Market Click here to view more.