India AFC Systems Market (2019-2025) | Share, Analysis, Trends, Industry, Outlook, Companies, Size, Growth, Revenue, Value & Forecast
Market Forecast By Applications (Metro Railway, Bus/BRTS Transport, Railway Transport, Parking Solution and Others), By AFC Technology (Near-Field Communication, Magnetic Strips & Tokens, QR Code/Barcode, and Smart Cards), By Types (Hardware, Software, and Services), By Regions (Northern, Eastern, Western and Southern) and Competitive Landscape
| Product Code: ETC000584 | Publication Date: Apr 2019 | Updated Date: Aug 2025 | Product Type: Report | |
| Publisher: 6Wresearch | Author: Ravi Bhandari | No. of Pages: 148 | No. of Figures: 53 | No. of Tables: 23 |
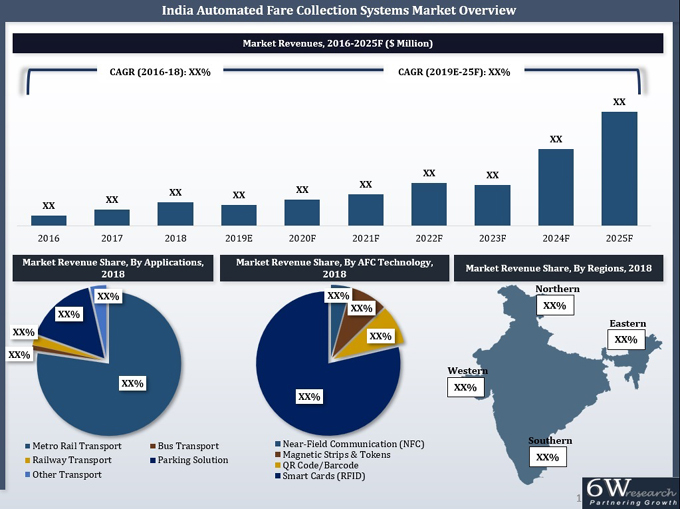
The rising need for faster payment process owing to the increase in a number of daily travelers /commuters has buoyed the demand for rapid payment solutions across India. Additionally, with smart city projects, the government is taking several key measures for the growth of rapid transport solutions in India, especially in the Tier-I and Tier-II cities. With the swift development of transport solutions, the Automated Fare Collection Systems (AFC) market has registered high growth over the past few years.According to 6Wresearch, India Automated Fare Collection (AFC) Market Size is projected to grow at a CAGR of 33.1% during 2019-25. In terms of market applications, metro railway transport dominated the overall market revenues due to the ability of these systems to deliver better management, revenue generation, and fraud prevention. Additionally, with increasing adoption of public transportation primarily, metro railways and rapid bus transport systems in Tier-I and II cities by daily commuters, the deployment of the AFC system is anticipated to increase in the existing facilities as well over the coming years.
In terms of regions, the Northern region accounted for the largest revenue share in India AFC market share in 2018. Moreover, the region is likely to generate key revenues in India AFC market forecast period owing to upcoming/ongoing metro railway projects and parking solutions, especially in the Delhi/NCR region.Some of the key players in India AFC market include- Samsung SDS, AGS Transact, Indra Sistemas, Thales India, AUM Infotech, Efkon India, Cubic Transportation, MCML Projects, Ingenico International, and NEC Technologies.The India AFC market report thoroughly covers the market by applications, AFC technology types, hardware & software systems, and regions. India AFC market outlook report provides an unbiased and detailed analysis of the on-going India AFC market trends, opportunities/high growth areas and market drivers which would help the stakeholders to device and align their market strategies according to the current and future market dynamics.
India AFC Systems Market is the growing market and covers all market applications such as hardware systems, AFC technology, software system, and the region also. AFC systems are a detailed analysis of the market trends and opportunities growth areas that align their strategies for the growth of the AFRC systems based on the current and future market. AFC stands for the Automated Fare Collection Systems. India AFC system market according to the research it will grow faster in the upcoming years. The AFC systems market covers any type of application and introduces new technology such as software systems and hardware systems and detailed analysis of the on-going AFC systems market. In India, the AFC systems market has trends, high growth areas/ opportunities and market drivers help the stakeholders align the market strategies according to the market condition based on the current and future market. The government of India also taking several steps for the growth of transport in the Tier-I and Tier-II cities.
Key Highlights of the Report:
• India AFC Market Overview
• India AFC Market Outlook
• India AFC Market Size and India AFC Market Forecast until 2025
• Historical Data & Forecast of India AFC Market Revenues, By Metro Railway Application, 2016-25F
• Historical Data & Forecast of India AFC Market Revenues, By Bus Transport Application, 2016-25F
• Historical Data & Forecast of India AFC Market Revenues, By Railway Application, 2016-25F
• Historical Data & Forecast of India AFC Market Revenues, By Parking Solution Application, 2016-25F
• Historical Data & Forecast of India AFC Market Revenues, By Other Application, 2016-25F
• Historical Data & Forecast of India AFC Market Revenues, By Metro Railway Hardware Vs. Software Vs. Services, 2016-25F
• Historical Data & Forecast of India AFC Market Revenues, By Bus Transport Hardware Vs.Software Vs. Services, 2016-25F
• Historical Data & Forecast of India AFC Market Revenues, By Railway Hardware Vs. Software Vs. Services, 2016-25F
• Historical Data & Forecast of India AFC Market Revenues, By Parking Solution Hardware Vs. Software Vs. Services, 2016-2025F
• Historical Data & Forecast Data of India AFC Market Revenues, By Technology, 2016-25F
• Historical Data & Forecast Data of India AFC Market Revenues, By Regions, 2016-2025F
• Market Drivers and Restraints
• India AFC Market Trends
• Porter's Five Forces Analysis and Market Opportunity Assessment
• India AFC Market Overview on Competitive Benchmarking
• India AFC Market Share, By Players
• Company Profiles
• Strategic Recommendations
Markets Covered:
India AFC Market report provides a detailed analysis of the following market segments:
• By Applications
o Metro Railway
o Bus/BRTS Transport
o Railway Transport
o Parking Solution
o Others
• By AFC Technology
o Near-Field Communication
o Magnetic Strips & Tokens
o QR Code/Barcode
o Smart Cards
• By Types
o Hardware
o Software
o Services
• By Regions
o Northern
o Eastern
o Western
o Southern
Frequently Asked Questions About the Market Study (FAQs):
6Wresearch actively monitors the India AFC Systems Market and publishes its comprehensive annual report, highlighting emerging trends, growth drivers, revenue analysis, and forecast outlook. Our insights help businesses to make data-backed strategic decisions with ongoing market dynamics. Our analysts track relevent industries related to the India AFC Systems Market, allowing our clients with actionable intelligence and reliable forecasts tailored to emerging regional needs.
Yes, we provide customisation as per your requirements. To learn more, feel free to contact us on sales@6wresearch.com
1 Executive Summary
2 Introduction
2.1 Report Description
2.2 Key Highlights Of The Report
2.3 Market Scope & Segmentation
2.4 Research Methodology
2.5 Assumptions
3 India Automated Fare Collection Systems Market Overview
3.1 Overview & Analysis
3.2 India Automated Fare Collection Systems Market Revenues (2016-2025F)
3.3 India Automated Fare Collection Systems Market Revenue Share, By Applications (2018 & 2025F)
3.4 India Automated Fare Collection Systems Market Revenue Share, By Technology (2018 & 2025F)
3.5 India Automated Fare Collection Systems Market Revenue Share, By Regions (2018 & 2025F)
3.6 India Automated Fare Collection Systems Market-Industry Life Cycle, 2018
3.7 India Automated Fare Collection Systems Market- Porter's Five Forces
4 India Automated Fare Collection Systems Market Dynamics
4.1 Impact Analysis
4.2 Market Drivers
4.3 Market Restraints
5 India Automated Fare Collection Systems Market Trends
5.1 National Common Mobility Card (NCMC) Upgradation Requirements For Open Loop Ticketing For Metro/Bus
5.2 QR Ticketing Requirements
6 India Automated Fare Collection Systems Market Overview, By Metro Railway Application
6.1 India Automated Fare Collection Systems Market Revenues, By Metro Railway Application, 2016-25F ($ Million)
6.2 India Metro Railway Automated Fare Collection Systems Market Revenue Share,
By Hardware Vs. Software Vs. Services (2018 & 2025F)
6.2.1 India Metro Railway Automated Fare Collection Systems Market Revenues,
By Hardware Vs. Software Vs. Services (2018 & 2025F)
6.3 India Automated Fare Collection Systems Market Revenues Share, By Hardware Type (2018 & 2025F)
6.3.1 India Metro Railway Automated Fare Collection Systems Market Revenues,
By Hardware Type, 2016-25F ($ Million)
6.4 India Metro Railway Projects Overview
6.4.1 India Metro Railway Market, By Annual AFC Ridership, 2016-25F (Million)
6.4.2 Key Metro Projects Market, By Annual AFC Ridership, in Million (2016-2025F)
6.4.3 India Metro Railway Market Revenues, By Segments, 2016-25F (Ticketing/Fare, Advertisement, Others)
6.4.4 India Metro Railway Market, By Fare Trend Analysis (2016-25F)
6.5 India Metro Automated Fare Collection Projects Outlook
6.6 India Monorail/LRT Automated Fare Collection Projects Outlook
7 India Automated Fare Collection Systems Market Overview, By Bus/BRTS Transport Application
7.1 India Automated Fare Collection Systems Market Revenues, By Bus/BRTS Transport Application,
2016-25F ($ Million)
7.2 India Bus/BRTS Transport Automated Fare Collection Systems Market Revenue Share,
By Hardware Vs. Software Vs. Services (2018 & 2025F)
7.2.1 India Bus/BRTS Transport Automated Fare Collection Systems Market Revenues,
By Hardware Vs. Software Vs. Services, 2016-25F ($ Million)
8 India Automated Fare Collection Systems Market Overview, By Railway Transport Application
8.1 India Automated Fare Collection Systems Market Revenues, By Railway Transport Application,
2016-25F ($ Million)
8.2 India Railway Transport Automated Fare Collection Systems Market Revenue Share,
By Hardware Vs. Software Vs. Services (2018 & 2025F)
8.2.1 India Railway Transport Automated Fare Collection Systems Market Revenues,
By Hardware Vs. Software Vs. Services, 2016-25F ($ Million)
8.3 India Railway Transport Automated Fare Collection Projects Outlook
9 India Automated Fare Collection Systems Market Overview, By Parking Solution Application
9.1 India Automated Fare Collection Systems Market Revenues, By Parking Solution Application,
2016-25F ($ Million)
9.2 India Parking Solution Automated Fare Collection Systems Market Revenue Share,
By Hardware Vs. Software Vs. Services (2018 & 2025F)
9.2.1 India Parking Solution Automated Fare Collection Systems Market Revenues,
By Hardware Vs. Software Vs. Services, 2016-25F ($ Million)
10 India Automated Fare Collection Systems Market Overview, By Other Applications
10.1 India Automated Fare Collection Systems Market Revenues, By Other Applications, 2016-25F ($ Million)
11 India Metro Information System Market Projects Overview
11.1 India Metro Information System Market Revenues, 2016-2025F ($ Million)
11.2 India Metro Information System Market Revenue Share, By Projects (2018 & 2025F)
11.2.1 India Metro Information System Market Revenues, By Projects, 2016-2025F ($ Million)
12 India Automated Fare Collection Systems Market Overview, By Technology
12.1 India Automated Fare Collection Systems Market Revenues, By NFC Technology, 2016-2025F ($ Million)
12.2 India Automated Fare Collection Systems Market Revenues, By Magnetic Strips & Tokens
Technology, 2016-2025F ($ Million)
12.3 India Automated Fare Collection Systems Market Revenues, By QR Code Technology
Technology, 2016-2025F ($ Million)
12.4 India Automated Fare Collection Systems Market Revenues, By Smart Cards Technology
Technology, 2016-2025F ($ Million)
13 India Automated Fare Collection Systems Market Overview, By Regions
13.1 India Automated Fare Collection Systems Market Revenues, By Northern Region, 2016-2025F ($ Million)
13.2 India Automated Fare Collection Systems Market Revenues, By Southern Region, 2016-2025F ($ Million)
13.3 India Automated Fare Collection Systems Market Revenues, By Western Region, 2016-2025F ($ Million)
13.4 India Automated Fare Collection Systems Market Revenues, By Eastern Region, 2016-2025F ($ Million)
14 India Automated Fare Collection Systems Market- Key Performance Indicators
15 India Automated Fare Collection Systems Market- Opportunity Assessment
15.1 India Automated Fare Collection Systems Market Opportunity Assessment, By Technology (2025F)
15.2 India Automated Fare Collection Systems Market Opportunity Assessment, By Applications (2025F)
16 India Automated Fare Collection Systems Market Competitive Landscape
16.1 India Automated Fare Collection Systems Market Revenue Share, By Company (2018)
16.2 India Automated Fare Collection Systems Market Competitive Benchmarking, By Operaing Parameters
17 Company Profiles
17.1 Samsung SDS India Pvt. Ltd.
17.2 AGS Transact Technologies Ltd.
17.3 Indra Sistemas India Pvt. Ltd.
17.4 Thales India Pvt. Ltd
17.5 AUM Infotech Pvt. Ltd.
17.6 Efkon India Pvt. Ltd.
17.7 Cubic Transportation System India Pvt. Ltd.
17.8 MCML Projects Pvt. Ltd.
17.9 Ingenico International India Pvt. Ltd.
17.10 NEC Technologies India Pvt. Ltd.
18 Strategic Recommendations
19 Disclaimer
List of Figures
Figure1 India Automated Fare Collection Systems Market Revenues, 2016-2025F ($ Million)
Figure2 Cumulative FDI inflows in India Construction Market, FY 2013-FY 1Q 2018 ($ Billion)
Figure3 India Automated Fare Collection Systems Market Revenue Share, By Applications, 2018 & 2025F
Figure4 India Automated Fare Collection Systems Market Revenue Share, By Technology (2018 & 2025F)
Figure5 India Automated Fare Collection Systems Market Revenue Share, By Regions , 2018 & 2025F
Figure6 India Automated Fare Collection Systems Market - Industry Life Cycle, 2018
Figure7 India Upcoming Infrastructure Projects
Figure8 India AFC Systems Market Revenue Share, By Metro Railway Application (2018 & 2025F)
Figure9 India AFC Systems Market Revenues, By Metro Railway Application, 2016-2025F ($ Million)
Figure10 India Metro Railway Automated Fare Collection Systems Market Revenue Share, By Hardware Vs. Software Vs. Services (2018 & 2025F)
Figure11 India Metro Railway AFC Systems Market Revenues Share, By Hardware Type (2018 & 2025F)
Figure12 Metro Railway Market, By Annual AFC Ridership, 2016-25F (Billion)
Figure13 India Metro Railway Market Revenues, By Segments (Ticketing/Fare, Advertisement, Others), 2016-25F ($ Million)
Figure14 India Metro Railway Market, By Fare Trend Analysis (2016-2025F)
Figure15 Details Of Metro Projects
Figure16 Details Of Ongoing & Upcoming Monorail/LRT Projects
Figure17 India AFC Systems Market Revenue Share, By Bus/BRTS Transport Application (2018 & 2025F)
Figure18 India AFC Systems Market Revenues, By Bus/BRTS Transport Application, 2016-2025F ($ Million)
Figure19 India Bus/BRTS Transport AFC Systems Market Revenue Share, By Hardware Vs. Software Vs. Services (2018 & 2025F)
Figure20 India AFC Systems Market Revenue Share, By Railway Transport Application (2018 & 2025F)
Figure21 India AFC Systems Market Revenues, By Railway Transport Application, 2016-2025F ($ Million)
Figure22 Projected Infrastructure Investment in Railways, 2013 - 2032 (INR Thousand Crore)
Figure23 India Railway Transport Automated Fare Collection Systems Market Revenue Share, By Hardware Vs. Software Vs. Services (2018 & 2025F)
Figure24 India AFC Systems Market Revenue Share, By Parking Solution Application (2018 & 2025F)
Figure25 India AFC Systems Market Revenues, By Parking Solution Application , 2016-2025F ($ Million)
Figure26 India Parking Solution AFC Systems Market Revenue Share, By Hardware Vs. Software Vs. Services (2018 & 2025F)
Figure27 India AFC Systems Market Revenue Share, By Other Applications (2018 & 2025F)
Figure28 India AFC Systems Market Revenues, By Other Applications, 2016-2025F ($ Million)
Figure29 India Metro Information System Market Revenues, 2016-2025F ($ Million)
Figure30 India Metro Information System Market Revenue Share (2018 & 2025F)
Figure31 India Metro Information System Market Revenues, By Signalling & Telecommunication System, 2016-2025F
Figure32 India Metro Information System Market Revenues, By Passenger Information System, 2016-2025F
Figure33 India AFC Systems Market Revenue Share, By NFC Technology (2018 & 2025F)
Figure34 India AFC Systems Market Revenues, By NFC Technology , 2016-2025F ($ Million)
Figure35 India AFC Systems Market Revenue Share, By Magnetic Strips & Tokens Technology, (2018 & 2025F)
Figure36 India AFC Systems Market Revenues, By Magnetic Strips & Tokens Technology, 2016-2025F ($ Million)
Figure37 India AFC Systems Market Revenue Share, By QR Code Technology, (2018 & 2025F)
Figure38 India AFC Systems Market Revenues, By QR Code Technology, 2016-2025F ($ Million)
Figure39 India AFC Systems Market Revenue Share, By Smart Cards Technology, (2018 & 2025F)
Figure40 India AFC Systems Market Revenues, By Smart Cards Technology, 2016-2025F ($ Million)
Figure41 India Automated Fare Collection Systems Market Revenue Share, By Northern Region (2018 & 2025F)
Figure42 India Automated Fare Collection Systems Market Revenue Share, By Southern Region (2018 & 2025F)
Figure43 India Automated Fare Collection Systems Market Revenue Share, By Western Region (2018 & 2025F)
Figure44 India Automated Fare Collection Systems Market Revenue Share, By Eastern Region (2018 & 2025F)
Figure45 India Actual Government Spending Vs Actual Government Revenues, FY2014-FY2019 (INR Lakh Crore)
Figure46 India Expected Government Budget Outlook, FY2019
Figure47 India Construction Industry Value, FY19 - FY21 (INR Lakh Crore)
Figure48 India Infrastructure Investment Forecast, 2017-2040 (INR Lakh Crore)
Figure49 India Infrastructure Investment Forecast, By Sector, 2017-2040 (INR Lakh Crore)
Figure50 India Automated Fare Collection Systems Market Opportunity Assessment, By Technology (2025F)
Figure51 India Automated Fare Collection Systems Market Opportunity Assessment, By Applications (2025F)
Figure52 India Automated Fare Collection Systems Market Revenue Share, By Company (2018)
Figure53 Expected Network Addition in Urban Rail Segment in India, 2019-2025 (km)
List of Tables
Table1 Shortlisted Smart Cities in First Round
Table2 India Metro Railway Fare At a Glance, in 2016 & 2018
Table3 India Delhi Metro Railway Revised Fare Prices (As on Dec. 2017)
Table4 India Metro Railway AFC Systems Market Revenues, By Hardware Vs. Software Vs. Services, 2016-2018 ($ Million)
Table5 India Metro Railway AFC Systems Market Revenues, By Hardware Vs. Software Vs. Services, 2019E-2025F ($ Million)
Table6 India Metro Railway AFC Systems Market Revenues, By Hardware Type, 2016-2018 ($ Million)
Table7 India Metro Railway AFC Systems Market Revenues, By Hardware Systems, 2019E-2025F ($ Million)
Table8 Key Metro Projects Analysis, By Annual Ridership, in Million (2016-2025F)
Table9 India DMRC Phase I and II Network At a Glance (As on April 2018)
Table10 India DMRC Phase III Network At a Glance (As on April 2018)
Table11 India Key BRTS Projects at a Glance (As on Nov 2017)
Table12 India Bus/BRTS Transport AFC Systems Market Revenues, By Hardware Vs. Software Vs. Services, 2016-2018 ($ Million)
Table13 India Bus/BRTS Transport AFC Systems Market Revenues, By Hardware Vs. Software Vs. Services, 2019E-2025F ($ Million)
Table14 India Railway Transport AFC Systems Market Revenues, By Hardware Vs. Software Vs. Services, 2016-2018 ($ Million)
Table15 India Railway Transport AFC Systems Market Revenues, By Hardware Vs. Software Vs. Services, 2019E-2025F ($ Million)
Table16 India Parking Solution AFC Systems Market Revenues, By Hardware Vs. Software Vs. Services, 2016-2018 ($ Million)
Table17 India Parking Solution AFC Systems Market Revenues, By Hardware Vs. Software Vs. Services, 2019E-2025F ($ Million)
Table18 India Key Amusement Parks, By States (2017)
Table19 India Under Construction and Planning Phase Metro Projects, By Northern Region
Table20 India Under Construction and Planning Phase Metro Projects, By Southern Region
Table21 India Under Construction and Planning Phase Metro Projects, By Eastern Region
Table22 India Under Construction and Planning Phase Metro Projects, By Western Region
Table23 India Top 5 Metro Railway Corporations, By Number of Metro Railway Stations (As on April 2018)
Global Go To Market Strategy - 2030
Export potential enables firms to identify high-growth global markets with greater confidence by combining advanced trade intelligence with a structured quantitative methodology. The framework analyzes emerging demand trends and country-level import patterns while integrating macroeconomic and trade datasets such as GDP and population forecasts, bilateral import–export flows, tariff structures, elasticity differentials between developed and developing economies, geographic distance, and import demand projections. Using weighted trade values from 2020–2024 as the base period to project country-to-country export potential for 2030, these inputs are operationalized through calculated drivers such as gravity model parameters, tariff impact factors, and projected GDP per-capita growth. Through an analysis of hidden potentials, demand hotspots, and market conditions that are most favorable to success, this method enables firms to focus on target countries, maximize returns, and global expansion with data, backed by accuracy.
By factoring in the projected importer demand gap that is currently unmet and could be potential opportunity, it identifies the potential for the Exporter (Country) among 190 countries, against the general trade analysis, which identifies the biggest importer or exporter.
To discover high-growth global markets and optimize your business strategy:
Click Here
Pricing
- Single User License$ 1,995
- Department License$ 2,400
- Site License$ 3,120
- Global License$ 3,795

Leadership Perspectives from Industry Events
Search
Thought Leadership and Analyst Meet


Our Clients
6WResearch In News
- India Air Conditioner Market Set for Strong Rebound in 2026 After Weather-Led Correction and GST-Driven Recovery: 6Wresearch
- ADAS in India: How Automatic Emergency Braking, Blind Spot Detection & Driver Monitoring are Transforming Road Safety
- Doha a strategic location for EV manufacturing hub: IPA Qatar
- Demand for luxury TVs surging in the GCC, says Samsung
- Empowering Growth: The Thriving Journey of Bangladesh’s Cable Industry
- Demand for luxury TVs surging in the GCC, says Samsung
Latest Reports
- Nicaragua RPG Gaming Market (2026-2032)
- New Zealand RPG Gaming Market (2026-2032)
- Netherlands RPG Gaming Market (2026-2032)
- Nauru RPG Gaming Market (2026-2032)
- Namibia RPG Gaming Market (2026-2032)
- Mozambique RPG Gaming Market (2026-2032)
- Montenegro RPG Gaming Market (2026-2032)
- Mongolia RPG Gaming Market (2026-2032)
- Monaco RPG Gaming Market (2026-2032)
- Micronesia RPG Gaming Market (2026-2032)
Industry Events and Analyst Meet

EV India Expo 2026

HIMTEX 2026

India Refining Summit 2026

India EV Show 2026

EV tech India Expo 2026
Whitepaper
- Middle East & Africa Commercial Security Market Click here to view more.
- Middle East & Africa Fire Safety Systems & Equipment Market Click here to view more.
- GCC Drone Market Click here to view more.
- Middle East Lighting Fixture Market Click here to view more.
- GCC Physical & Perimeter Security Market Click here to view more.