Indonesia Sporting and Athletic Goods Market (2026-2032) | Trends, Industry, Revenue, Share, Outlook, Forecast, Value, Growth, Companies, Size & Analysis
Market Forecast By Type (Fishing Equipment, Skating and Skiing Equipment, Golf Equipment, Other Sporting Equipment), By Distribution Channel (Hypermarket/supermarket, Convenience/Departmental Store, Specialty Store, Online Store, Others) And Competitive Landscape
| Product Code: ETC017148 | Publication Date: Jul 2023 | Updated Date: Jun 2026 | Product Type: Report | |
| Publisher: 6Wresearch | Author: Ravi Bhandari | No. of Pages: 70 | No. of Figures: 35 | No. of Tables: 5 |
Indonesia Sporting and Athletic Goods Market Summary
The indonesia sporting and athletic goods market was estimated at USD 194 Million in 2025 and is projected to reach USD 257 Million by 2032, growing at a CAGR of 5.6% from 2026 to 2032.
Indonesia Sporting and Athletic Goods Market Growth Rate Analysis (2021-2032)
The Indonesian sporting and athletic goods market is experiencing a robust recovery and upward expansion, rebounding from a slight decline of -0.5% in 2021. Driven by increasing consumer interest in healthy lifestyles, the market rebounded to 4.5% growth in 2022 and gained further momentum, reaching 5.2% in 2023. Projections suggest continued strong performance, with growth rates hovering around 5.6% through 2026, supported by investments in local manufacturing and infrastructure enhancement. As digitalization influences consumer purchasing behaviors, online sales channels are gaining traction, driving demand. Policy initiatives promoting sports and physical activity are also contributing to this positive trend, setting a favorable environment for sustained growth through the decade.
Indonesia Sporting and Athletic Goods Market Year-wise Growth Rate and Key Drivers
This graph highlights how the Indonesia Sporting and Athletic Goods Market has steadily grown over the past five years, supported by major growth factors.
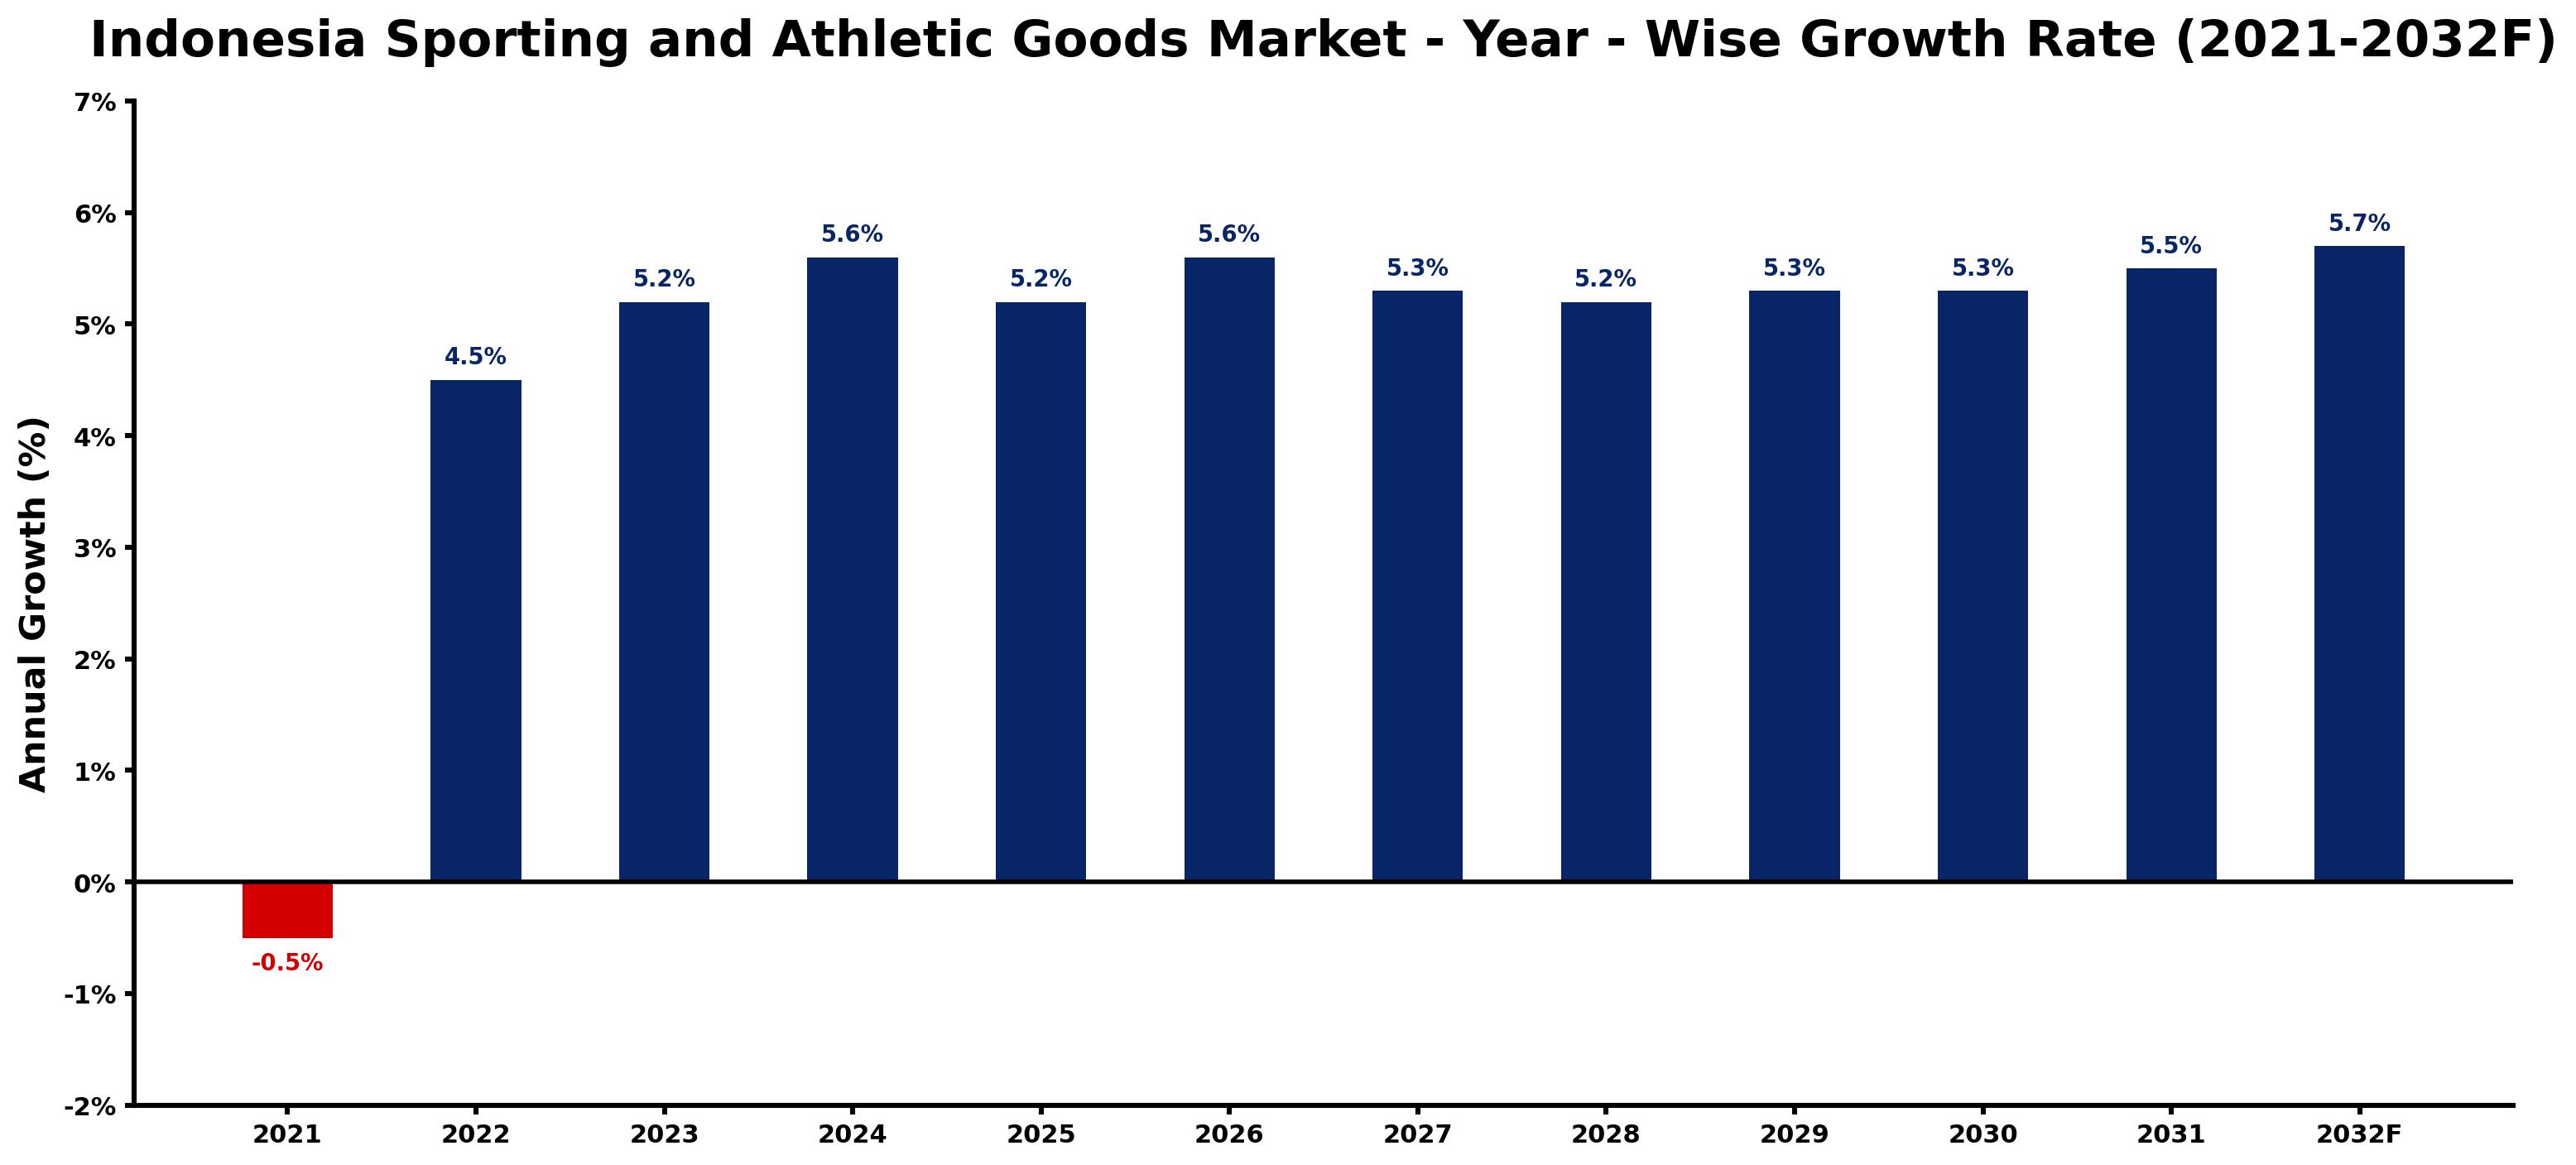
The table below presents the year wise growth rates along with the key drivers influencing the market
| Year | Growth Rate | Major Drivers |
| 2021 | -0.5% | Increased health concerns regarding outdoor sports participation led to diminished consumer enthusiasm and reduced sales. |
| 2022 | 4.5% | Health-conscious urban youth increasingly invested in personal fitness and sporting gear. |
| 2023 | 5.2% | E-commerce platforms provided widespread accessibility to diverse athletic equipment options. |
| 2024 | 5.6% | Local sporting events surged, boosting awareness and visibility of athletic brands. |
| 2025 | 5.2% | Sustainable product preferences shifted consumer choices toward eco-friendly athletic gear. |
| 2026 | 5.6% | Collaborations between brands and local influencers amplified market penetration strategies. |
| 2027 | 5.3% | Infrastructure developments created more accessible sports facilities throughout major cities. |
| 2028 | 5.2% | Increased participation in international competitions inspired local athletes to seek quality gear. |
| 2029 | 5.3% | Technological innovations in sporting equipment captured interest among tech-savvy consumers. |
| 2030 | 5.3% | Youth engagement programs integrated athletics into school curriculums, enhancing brand loyalty. |
| 2031 | 5.5% | Mobile fitness applications encouraged home workouts, leading to increased equipment purchases. |
| 2032 | 5.7% | Emerging fitness trends expanded the market for specialized sporting goods and accessories. |
Note - Market size estimations and growth projections presented in this report are based on 6Wresearch's advanced forecasting approach, validated with industry datasets as of June 2026.
Indonesia Sporting and Athletic Goods Market Synopsis
The Indonesia Sporting and Athletic Goods Market is projected to reach 5.6% and witness significant growth during the forecast period (2026-2032). Increasing urbanization, an evolving lifestyle, and a growing affinity for sports and fitness among the Indonesian population have created a robust demand for sporting goods. This demand is further fueled by rising disposable incomes and an enhanced awareness of the health benefits associated with physical activities.
Indonesia Sporting and Athletic Goods Market Growth Drivers
An array of factors is contributing to the growth trajectory of the Indonesia Sporting and Athletic Goods Market:
- Increasing disposable income levels have enabled consumers to allocate a portion of their earnings towards sports and fitness equipment. This shift has led to greater sales of products like racquets, bats, balls, and bicycles, positively impacting market expansion.
- The growing tendency of individuals to engage in sports activities, whether through organized leagues or community events, is driving demand for athletic goods. Events such as the Jakarta Marathon have become popular, encouraging higher participation rates and thereby enhancing sales of sports gear.
- The rise of health awareness in Indonesia has motivated more people to incorporate fitness into their daily routines. This consciousness is translating into increased interest in athletic goods, as consumers seek out products that support their fitness goals.
- Technological advancements in sporting goods, such as the introduction of smart wearable devices, are transforming consumer purchasing behavior. These innovations offer real-time tracking and performance analytics, catering to a market increasingly focused on data-driven fitness approaches.
- Marketing strategies, including sponsorship of sports events and partnerships with local fitness influencers, have amplified brand visibility and consumer engagement. These efforts are stimulating interest and increasing sales across various categories of sporting goods.
Indonesia Sporting and Athletic Goods Market Trends and Opportunities
The Indonesia Sporting and Athletic Goods Market is experiencing several notable trends that indicate future opportunities for growth:
- There is a notable shift toward sustainability in product manufacturing and packaging. Companies are increasingly prioritizing eco-friendly materials, which resonates with environmentally conscious consumers.
- The surge in e-commerce platforms is altering the buying landscape. Consumers are gravitating towards online shopping for its convenience, prompting brands to refine their digital marketing strategies and optimize their online presence.
- An increase in youth engagement in fitness programs and sports clubs is anticipated to bolster demand for athletic goods. Educational institutions and local governments are introducing initiatives aimed at promoting physical activity among younger demographics.
- Collaborations between sporting brands and technology firms are likely to result in innovative product offerings that combine fitness with technology, further attracting a tech-savvy consumer base.
- Local manufacturing initiatives aimed at reducing costs and enhancing product accessibility will also play a crucial role in expanding market presence for various brands, leading to heightened competition.
Indonesia Sporting and Athletic Goods Market Challenges and Restraints
While the Indonesia Sporting and Athletic Goods Market is poised for growth, several challenges could potentially hinder progress:
- High import duties and tariffs on foreign sporting goods can inflate prices, making them less competitive compared to locally produced products. This issue may deter potential buyers from premium brands.
- The market is inundated with counterfeit products that undermine genuine brands. This prevalence can erode consumer trust and impact overall market growth.
- Economic fluctuations and uncertainties can influence consumer spending habits, particularly in discretionary categories such as sporting goods. Economic downturns could lead to reduced expenditure on non-essential items.
- Limited awareness of the benefits of physical fitness among certain demographics poses a challenge. Targeted educational campaigns may be necessary to increase market penetration.
- Distribution challenges in reaching remote areas may impact sales figures, as consumers in rural regions may have limited access to quality sporting goods.
Indonesia Sporting and Athletic Goods Market Government Investment and Initiatives
The Indonesian government has recognized the potential of the sporting goods sector and is actively investing in initiatives aimed at boosting the industry:
- Government programs promoting sports for health and social cohesion have been bolstered by increased public spending on sports facilities and community programs, directly impacting the demand for athletic goods.
- Investment in the development of sports infrastructure, including stadiums and training centers, aims to encourage greater participation in sports. This investment generates increased demand for associated products.
- Public-private partnerships in hosting international sports events are being prioritized, creating significant opportunities for local brands to showcase their offerings on a global platform.
- Schemes promoting physical education in schools are being implemented, aiming to instill the importance of fitness in younger generations, which is expected to increase long-term demand for sports equipment.
- The government is looking to establish policies that incentivize local manufacturing of sporting goods to reduce reliance on imports and stimulate domestic economic growth.
Indonesia Sporting and Athletic Goods Market Latest Developments (May 2025 - June 2026)
Recent developments in the Indonesia Sporting and Athletic Goods Market indicate a dynamic landscape during the period from May 2025 to June 2026:
- The emphasis on digital transformation among sporting brands has accelerated, with a focus on enhancing online platforms and direct-to-consumer sales channels, reflecting changing purchasing behaviors.
- There has been a noticeable increase in the organization of local sports events, fostering community engagement and promoting local brands, which in turn boosts sales of athletic goods.
- The continued rise of health-consciousness among consumers has prompted brands to launch innovative products tailored specifically for health and fitness tracking.
- Collaborations between athletic brands and fitness influencers have gained traction, leveraging social media platforms to broaden audience reach and boost brand loyalty.
- Manufacturers are increasingly adopting sustainable practices in production, responding to consumer demand for eco-friendly goods, which is enhancing brand image and driving sales.
Indonesia Sporting and Athletic Goods Market - Key Attractiveness of the Report
- 10 Years of Market Numbers
- Historical Data Starting from 2022 to 2025
- Base Year: 2025
- Forecast Data until 2032
- Key Performance Indicators Impacting the Market
- Major Upcoming Developments and Projects
Key Highlights of the Report:
- Indonesia Sporting and Athletic Goods Market Outlook
- Market Size of Indonesia Sporting and Athletic Goods Market, 2025
- Forecast of Indonesia Sporting and Athletic Goods Market, 2032F
- Historical Data and Forecast of Indonesia Sporting and Athletic Goods Revenues & Volume for the Period 2022-2032F
- Indonesia Sporting and Athletic Goods Market Trend Evolution
- Indonesia Sporting and Athletic Goods Market Drivers and Challenges
- Indonesia Sporting and Athletic Goods Price Trends
- Indonesia Sporting and Athletic Goods Porter's Five Forces
- Indonesia Sporting and Athletic Goods Industry Life Cycle
- Historical Data and Forecast of Indonesia Sporting and Athletic Goods Market Revenues & Volume By Type for the Period 2022-2032F
- Historical Data and Forecast of Indonesia Sporting and Athletic Goods Market Revenues & Volume By Fishing Equipment for the Period 2022-2032F
- Historical Data and Forecast of Indonesia Sporting and Athletic Goods Market Revenues & Volume By Skating and Skiing Equipment for the Period 2022-2032F
- Historical Data and Forecast of Indonesia Sporting and Athletic Goods Market Revenues & Volume By Golf Equipment for the Period 2022-2032F
- Historical Data and Forecast of Indonesia Sporting and Athletic Goods Market Revenues & Volume By Other Sporting Equipment for the Period 2022-2032F
- Historical Data and Forecast of Indonesia Sporting and Athletic Goods Market Revenues & Volume By ?Distribution Channel for the Period 2022-2032F
- Historical Data and Forecast of Indonesia Sporting and Athletic Goods Market Revenues & Volume By Hypermarket/supermarket for the Period 2022-2032F
- Historical Data and Forecast of Indonesia Sporting and Athletic Goods Market Revenues & Volume By Convenience/Departmental Store for the Period 2022-2032F
- Historical Data and Forecast of Indonesia Sporting and Athletic Goods Market Revenues & Volume By Specialty Store for the Period 2022-2032F
- Historical Data and Forecast of Indonesia Sporting and Athletic Goods Market Revenues & Volume By Online Store for the Period 2022-2032F
- Historical Data and Forecast of Indonesia Sporting and Athletic Goods Market Revenues & Volume By Others for the Period 2022-2032F
- Indonesia Sporting and Athletic Goods Import Export Trade Statistics
- Market Opportunity Assessment By Type
- Market Opportunity Assessment By ?Distribution Channel
- Indonesia Sporting and Athletic Goods Top Companies Market Share
- Indonesia Sporting and Athletic Goods Competitive Benchmarking By Technical and Operational Parameters
- Indonesia Sporting and Athletic Goods Company Profiles
- Indonesia Sporting and Athletic Goods Key Strategic Recommendations
Frequently Asked Questions About the Market Study (FAQs):
A1: The Indonesia Sporting and Athletic Goods Market is projected to experience significant growth during the forecast period of 2026-2032.
A2: Government initiatives aimed at promoting sports participation and developing infrastructure are enhancing the demand for sporting goods in Indonesia.
A3: Trends such as the rise of e-commerce, sustainability in manufacturing, and growing youth engagement in fitness programs are shaping the market.
A4: Challenges include high import duties, counterfeit products, and limited awareness of fitness benefits among certain demographics.
6Wresearch actively monitors the Indonesia Sporting and Athletic Goods Market and publishes its comprehensive annual report, highlighting emerging trends, growth drivers, revenue analysis, and forecast outlook. Our insights help businesses to make data-backed strategic decisions with ongoing market dynamics. Our analysts track relevent industries related to the Indonesia Sporting and Athletic Goods Market, allowing our clients with actionable intelligence and reliable forecasts tailored to emerging regional needs.
Yes, we provide customisation as per your requirements. To learn more, feel free to contact us on sales@6wresearch.com
1 Executive Summary |
2 Introduction |
2.1 Key Highlights of the Report |
2.2 Report Description |
2.3 Market Scope & Segmentation |
2.4 Research Methodology |
2.5 Assumptions |
3 Indonesia Sporting and Athletic Goods Market Overview |
3.1 Indonesia Country Macro Economic Indicators |
3.2 Indonesia Sporting and Athletic Goods Market Revenues & Volume, 2022 & 2032F |
3.3 Indonesia Sporting and Athletic Goods Market - Industry Life Cycle |
3.4 Indonesia Sporting and Athletic Goods Market - Porter's Five Forces |
3.5 Indonesia Sporting and Athletic Goods Market Revenues & Volume Share, By Type, 2022 & 2032F |
3.6 Indonesia Sporting and Athletic Goods Market Revenues & Volume Share, By Distribution Channel, 2022 & 2032F |
4 Indonesia Sporting and Athletic Goods Market Dynamics |
4.1 Impact Analysis |
4.2 Market Drivers |
4.3 Market Restraints |
5 Indonesia Sporting and Athletic Goods Market Trends |
6 Indonesia Sporting and Athletic Goods Market, By Types |
6.1 Indonesia Sporting and Athletic Goods Market, By Type |
6.1.1 Overview and Analysis |
6.1.2 Indonesia Sporting and Athletic Goods Market Revenues & Volume, By Type, 2022-2032F |
6.1.3 Indonesia Sporting and Athletic Goods Market Revenues & Volume, By Fishing Equipment, 2022-2032F |
6.1.4 Indonesia Sporting and Athletic Goods Market Revenues & Volume, By Skating and Skiing Equipment, 2022-2032F |
6.1.5 Indonesia Sporting and Athletic Goods Market Revenues & Volume, By Golf Equipment, 2022-2032F |
6.1.6 Indonesia Sporting and Athletic Goods Market Revenues & Volume, By Other Sporting Equipment, 2022-2032F |
6.2 Indonesia Sporting and Athletic Goods Market, By Distribution Channel |
6.2.1 Overview and Analysis |
6.2.2 Indonesia Sporting and Athletic Goods Market Revenues & Volume, By Hypermarket/supermarket, 2022-2032F |
6.2.3 Indonesia Sporting and Athletic Goods Market Revenues & Volume, By Convenience/Departmental Store, 2022-2032F |
6.2.4 Indonesia Sporting and Athletic Goods Market Revenues & Volume, By Specialty Store, 2022-2032F |
6.2.5 Indonesia Sporting and Athletic Goods Market Revenues & Volume, By Online Store, 2022-2032F |
6.2.6 Indonesia Sporting and Athletic Goods Market Revenues & Volume, By Others, 2022-2032F |
7 Indonesia Sporting and Athletic Goods Market Import-Export Trade Statistics |
7.1 Indonesia Sporting and Athletic Goods Market Export to Major Countries |
7.2 Indonesia Sporting and Athletic Goods Market Imports from Major Countries |
8 Indonesia Sporting and Athletic Goods Market Key Performance Indicators |
9 Indonesia Sporting and Athletic Goods Market - Opportunity Assessment |
9.1 Indonesia Sporting and Athletic Goods Market Opportunity Assessment, By Type, 2022 & 2032F |
9.2 Indonesia Sporting and Athletic Goods Market Opportunity Assessment, By Distribution Channel, 2022 & 2032F |
10 Indonesia Sporting and Athletic Goods Market - Competitive Landscape |
10.1 Indonesia Sporting and Athletic Goods Market Revenue Share, By Companies, 2025 |
10.2 Indonesia Sporting and Athletic Goods Market Competitive Benchmarking, By Operating and Technical Parameters |
11 Company Profiles |
12 Recommendations |
13 Disclaimer |
Global Go To Market Strategy - 2030
Export potential enables firms to identify high-growth global markets with greater confidence by combining advanced trade intelligence with a structured quantitative methodology. The framework analyzes emerging demand trends and country-level import patterns while integrating macroeconomic and trade datasets such as GDP and population forecasts, bilateral import–export flows, tariff structures, elasticity differentials between developed and developing economies, geographic distance, and import demand projections. Using weighted trade values from 2020–2024 as the base period to project country-to-country export potential for 2030, these inputs are operationalized through calculated drivers such as gravity model parameters, tariff impact factors, and projected GDP per-capita growth. Through an analysis of hidden potentials, demand hotspots, and market conditions that are most favorable to success, this method enables firms to focus on target countries, maximize returns, and global expansion with data, backed by accuracy.
By factoring in the projected importer demand gap that is currently unmet and could be potential opportunity, it identifies the potential for the Exporter (Country) among 190 countries, against the general trade analysis, which identifies the biggest importer or exporter.
To discover high-growth global markets and optimize your business strategy:
Click Here
Pricing
- Single User License$ 1,995
- Department License$ 2,400
- Site License$ 3,120
- Global License$ 3,795

Leadership Perspectives from Industry Events
Search
Thought Leadership and Analyst Meet


Our Clients
6WResearch In News
- India Air Conditioner Market Set for Strong Rebound in 2026 After Weather-Led Correction and GST-Driven Recovery: 6Wresearch
- ADAS in India: How Automatic Emergency Braking, Blind Spot Detection & Driver Monitoring are Transforming Road Safety
- Doha a strategic location for EV manufacturing hub: IPA Qatar
- Demand for luxury TVs surging in the GCC, says Samsung
- Empowering Growth: The Thriving Journey of Bangladesh’s Cable Industry
- Demand for luxury TVs surging in the GCC, says Samsung
Latest Reports
- Nicaragua RPG Gaming Market (2026-2032)
- New Zealand RPG Gaming Market (2026-2032)
- Netherlands RPG Gaming Market (2026-2032)
- Nauru RPG Gaming Market (2026-2032)
- Namibia RPG Gaming Market (2026-2032)
- Mozambique RPG Gaming Market (2026-2032)
- Montenegro RPG Gaming Market (2026-2032)
- Mongolia RPG Gaming Market (2026-2032)
- Monaco RPG Gaming Market (2026-2032)
- Micronesia RPG Gaming Market (2026-2032)
Industry Events and Analyst Meet

HIMTEX 2026

India Refining Summit 2026

India EV Show 2026

EV tech India Expo 2026

Auto Tech Asia 2026
Whitepaper
- Middle East & Africa Commercial Security Market Click here to view more.
- Middle East & Africa Fire Safety Systems & Equipment Market Click here to view more.
- GCC Drone Market Click here to view more.
- Middle East Lighting Fixture Market Click here to view more.
- GCC Physical & Perimeter Security Market Click here to view more.